Gold Technical Analysis: The recent recovery move already seems to have run out of steam
• The precious metal extended overnight retracement slide from two-week lows and was weighed down by a combination of negative factors - a goodish pickup in the USD demand and fading safe-haven demand.
• With short-term technical indicators already seemed losing positive momentum, the fact that it has slipped back below 100-hour SMA, for the first time since last Tuesday, points to a bearish set-up.
• A follow-through weakness below 38.2% Fibonacci retracement level of the $1238-$1266 recent recovery move would add credence to the near-term negative outlook.
Gold 1-hourly chart
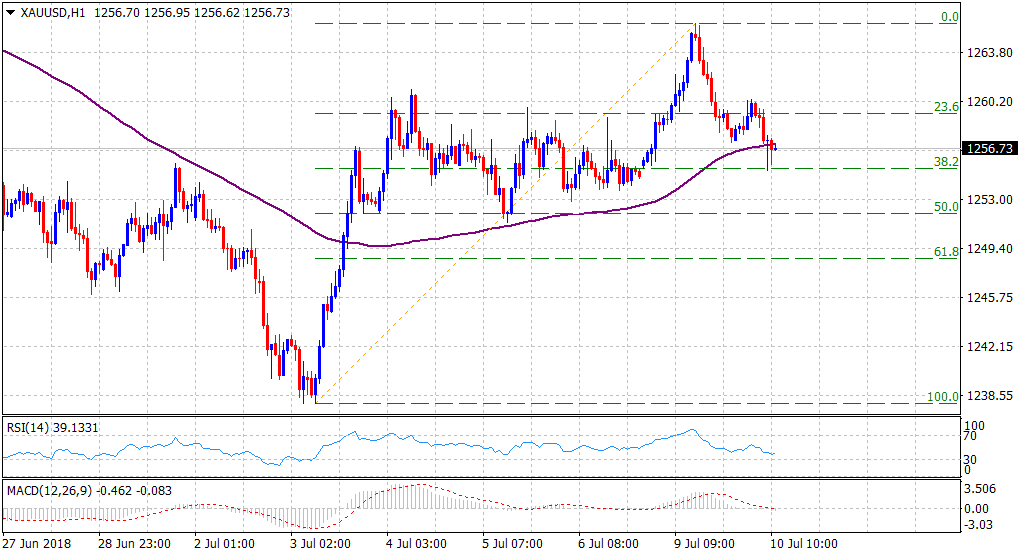
Spot Rate: $1256.73
Daily High: $1260.38
Daily Low: $1255.13
Trend: Bearish
Resistance
R1: $1259 (23.6% Fibo. retracement level)
R2: $1266 (overnight swing high)
R3: $1273 (an important support break-point)
Support
S1: $1252 (50% Fibo. retracement level)
S2: $1248 (horizontal zone)
S3: $1242 (recent daily closing low)