Back
19 Nov 2018
AUD/JPY Technical Analysis: Remains trapped inside of last week's range
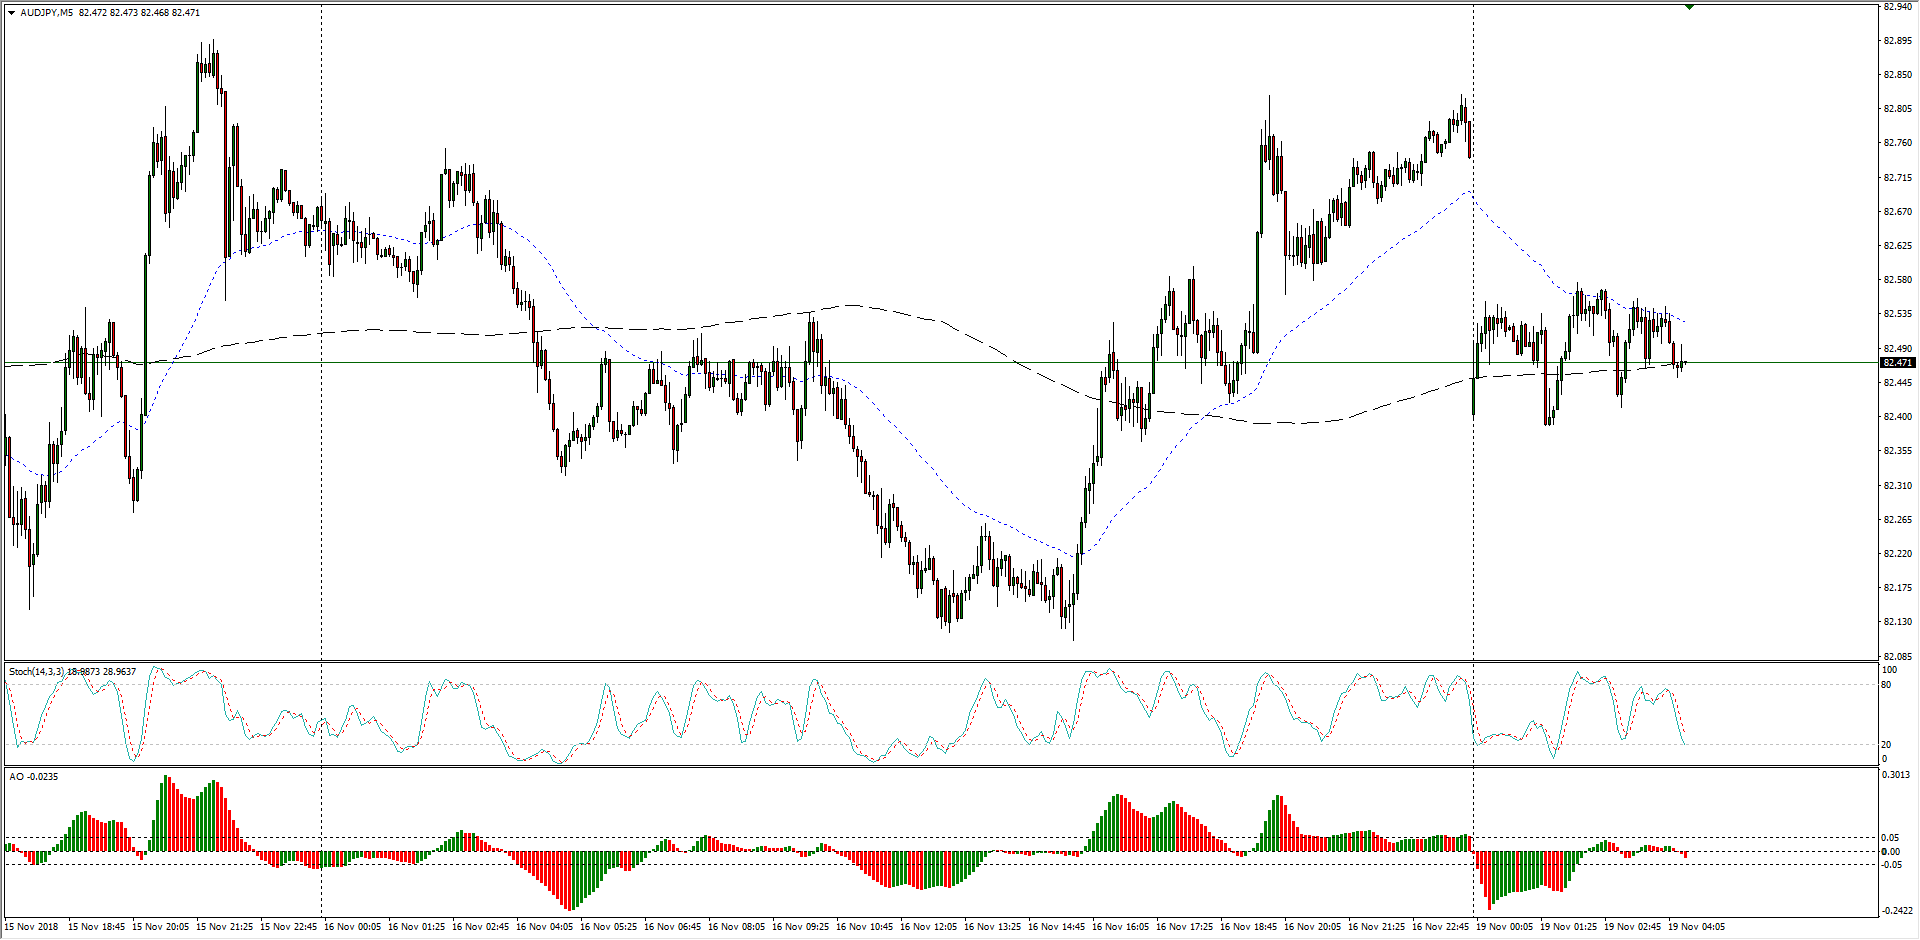
- The AUD/JPY is trading tersely near 82.50 after Monday's bearish gap leaves the pair hobbled within Friday's trading range.
AUD/JPY Chart, 5-Minute

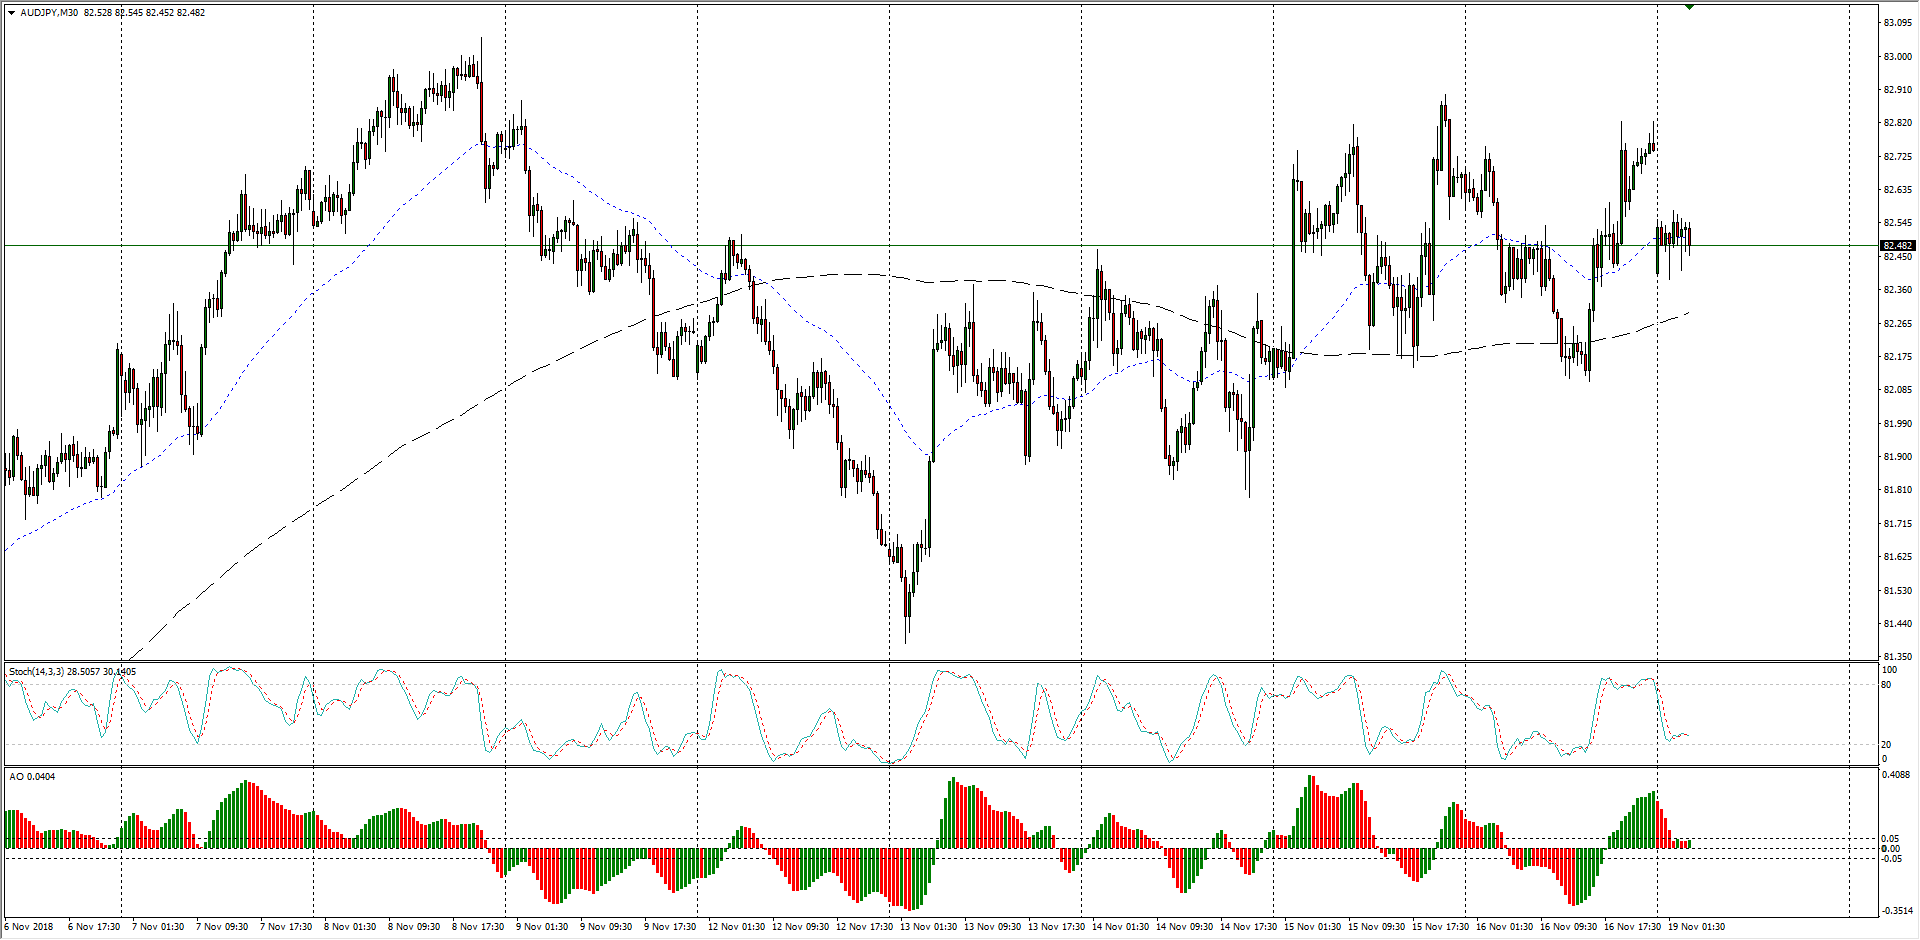
- Over the past two weeks, the Aussie0Yen pairing has become familiar with the current range zone, especially in the latter half of last week, though the pair does remain buoyed from the near-term low of 81.40.
AUD/JPY Chart, 30-Minute

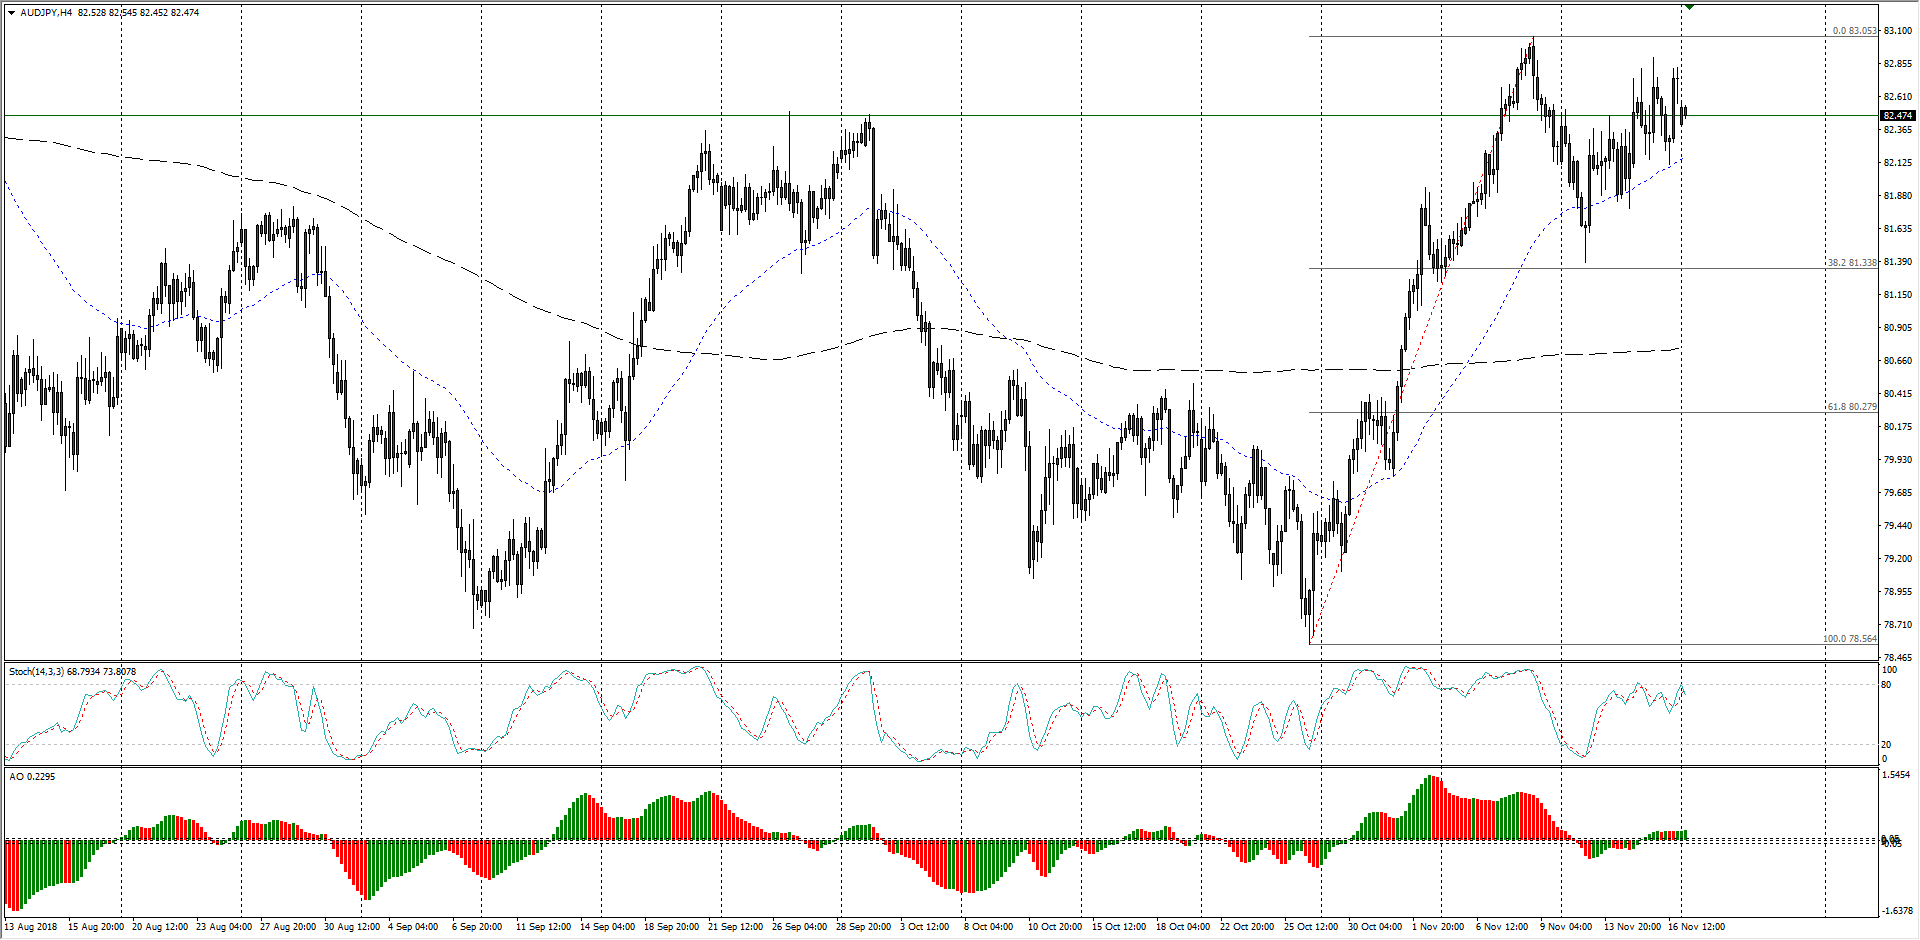
- The past three months have the AUD/JPY trading inside of a rough long-term range, though support is being found for a potential upmove from the 38.2% Fibo retracement level from 81.35, while a bearish break down will take the AUD/JPY back into October's bottoms near 78.50.
AUD/JPY Chart, 4-Hour

AUD/JPY
Overview:
Last Price: 82.47
Daily change: -26 pips
Daily change: -0.314%
Daily Open: 82.73
Trends:
Daily SMA20: 81.14
Daily SMA50: 80.87
Daily SMA100: 81.29
Daily SMA200: 82.01
Levels:
Daily High: 82.84
Daily Low: 82.11
Weekly High: 82.9
Weekly Low: 81.39
Monthly High: 82.5
Monthly Low: 78.56
Daily Fibonacci 38.2%: 82.56
Daily Fibonacci 61.8%: 82.39
Daily Pivot Point S1: 82.28
Daily Pivot Point S2: 81.83
Daily Pivot Point S3: 81.55
Daily Pivot Point R1: 83.01
Daily Pivot Point R2: 83.28
Daily Pivot Point R3: 83.73
