Back
9 Apr 2019
USD/IDR Technical Analysis: Symmetrical triangle in play, 14120 is the level to beat for bears
The USD/IDR pair is trading near the intra-day low of 14,150 during the early Asian session on Tuesday.
If observing its trading pattern since March 20, the quote is likely forming a short-term symmetrical triangle between 14,120 – 14,250 area.
However, the pattern support of 14,120 has an additional back-up of 61.8% Fibonacci retracement level of February 25 to March 08 upside, making it a tough challenge for sellers.
Should the bears manage to conquer 14,120 rest-point, they can quickly aim for 14,000 and 13,960 ahead of taking rest near 13,940.
Meanwhile, an upside clearance of 14,250 can open the door for the quote’s further advances toward 14,340 and 14,420 numbers to the north.
USD/IDR 4-Hour chart
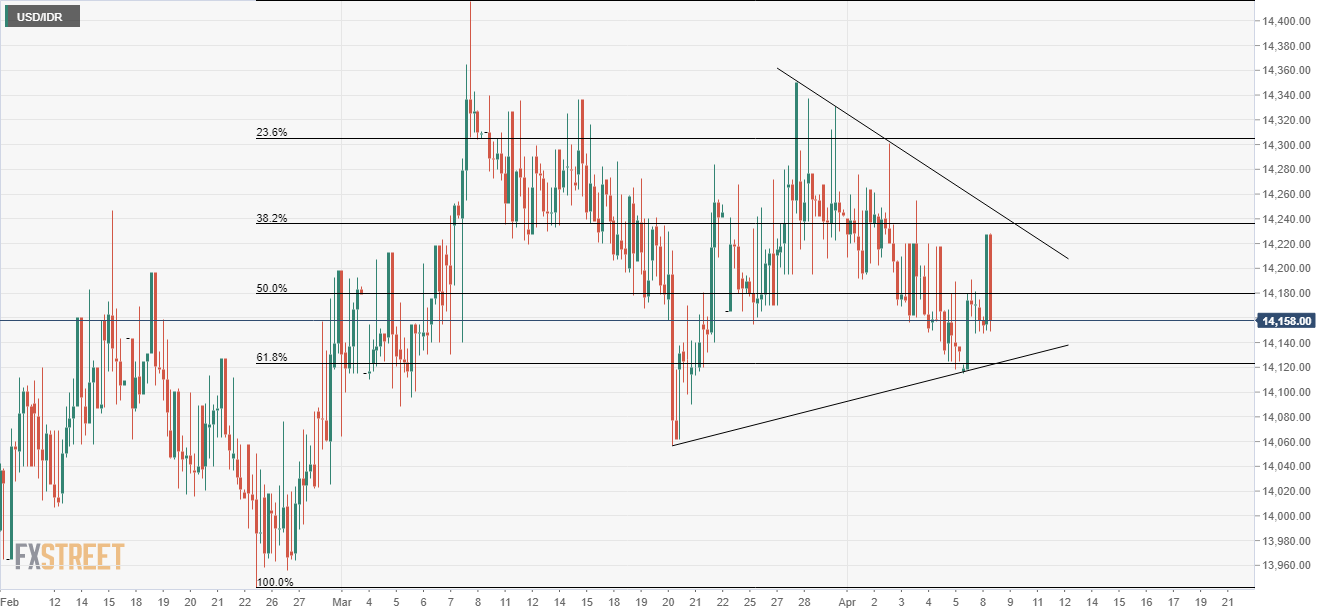
Trend: Mildly negative