Back
12 Jul 2019
EUR/USD technical anlysis: Fiber finds resistance at the 1.1263 level
- EUR/USD is finding intraday resistance at the 1.1263 level.
- The level to beat for bears is 1.1245 followed by 1.1220.
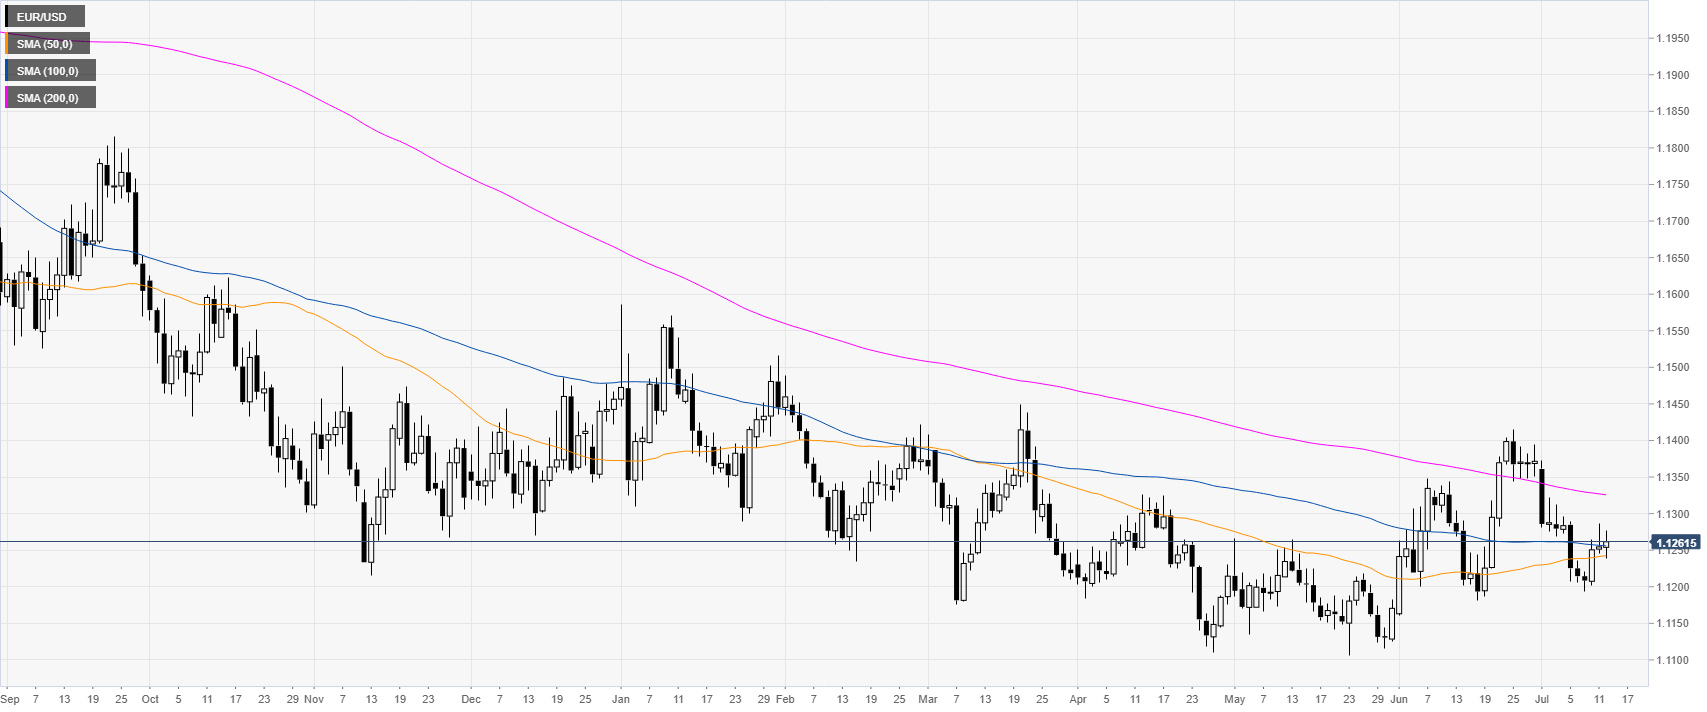
EUR/USD daily chart
EUR/USD is in a bear trend below the 1.1300 handle and its 200-day simple moving averages (DSMAs). The market is trading just above the 100 SMA.

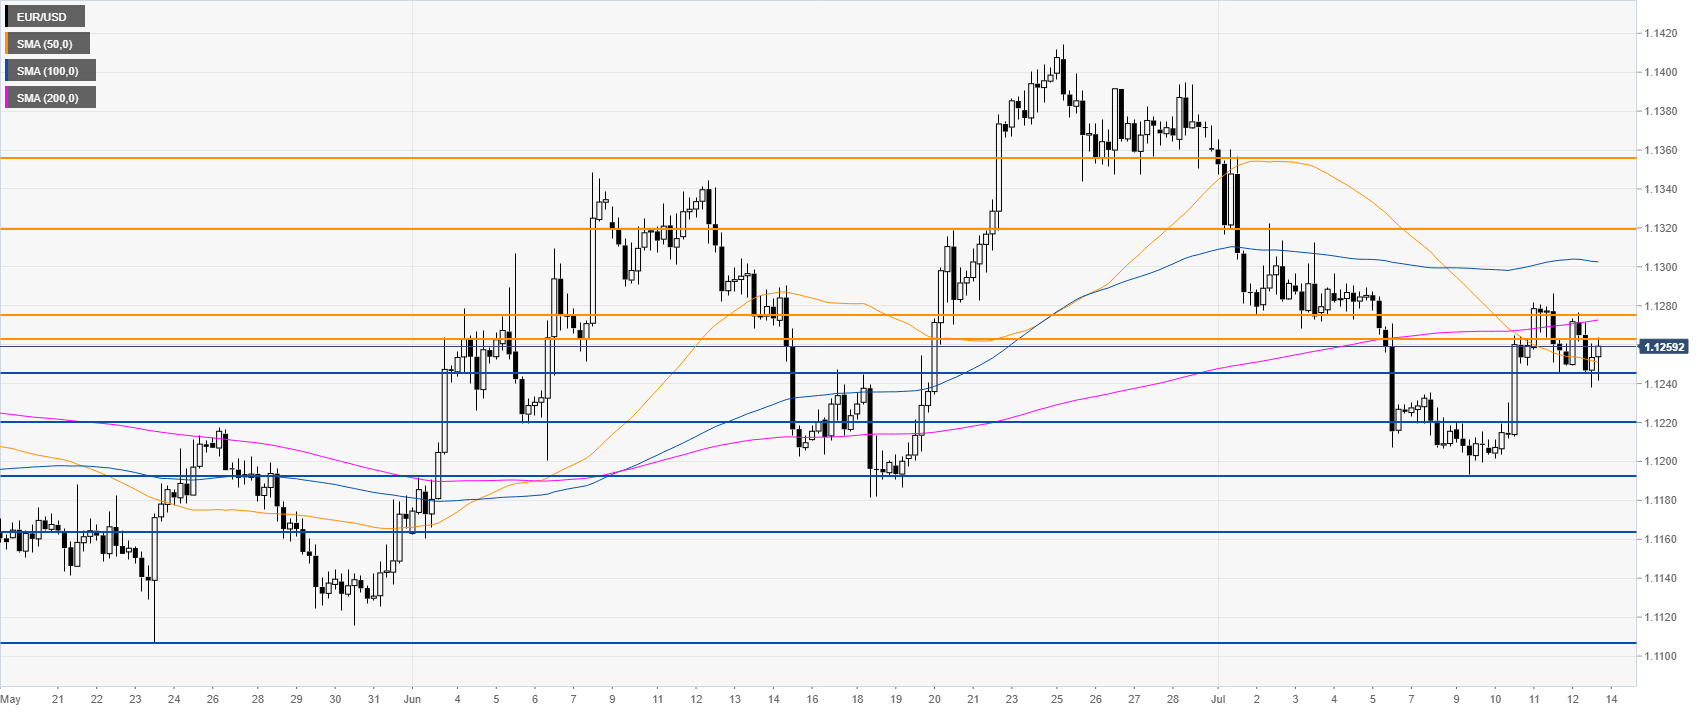
EUR/USD 4-hour chart
EUR/USD is trading just below 1.1263 resistance and the 200 SMA. The level to beat for bears is seen at 1.1245 followed by 1.1220, according to the Technical Confluences Indicator.

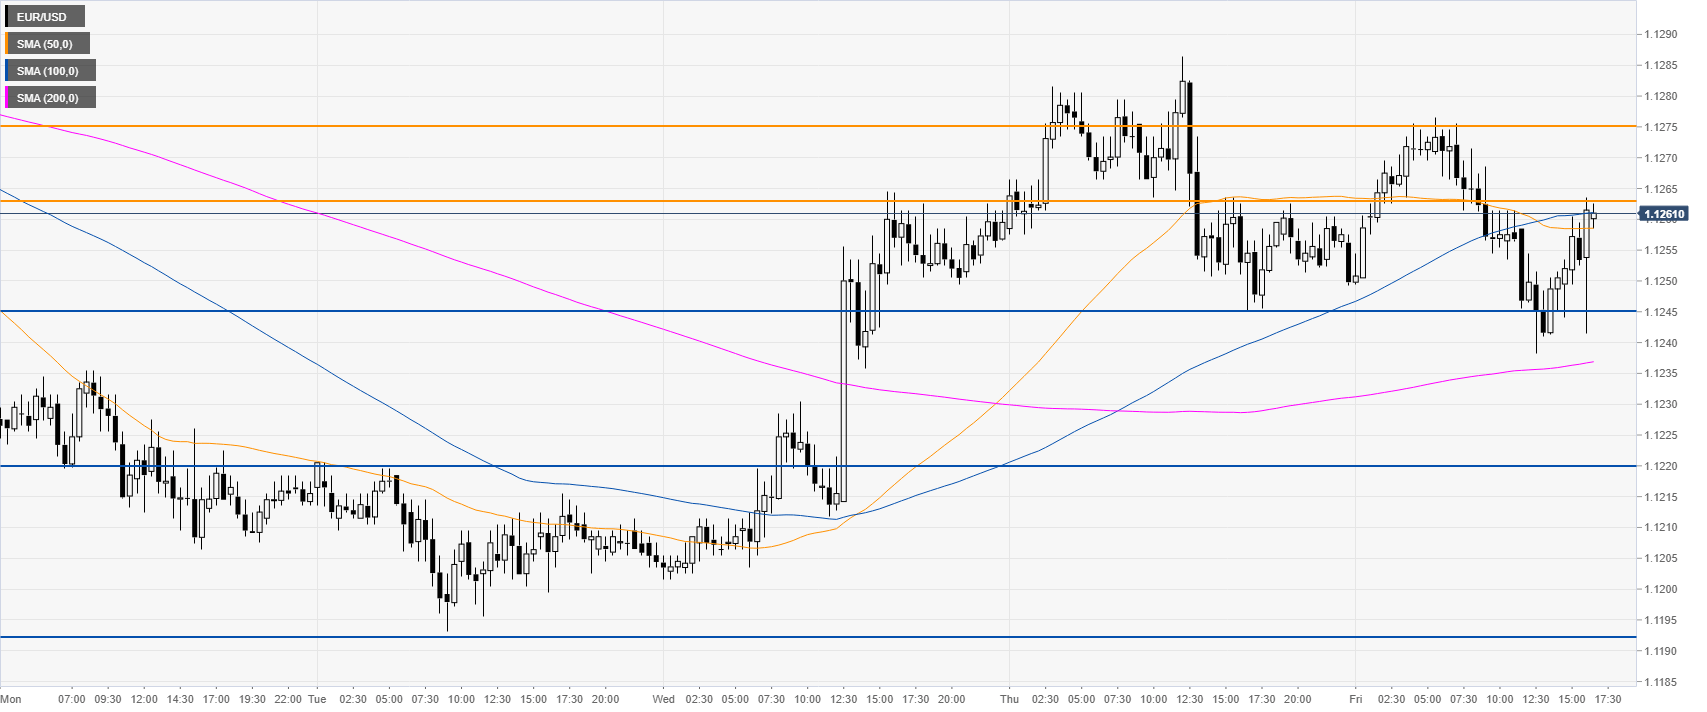
EUR/USD 30-minute chart
EUR/USD found resistance below 1.1263 and the 100 SMAs. In case 1.1263 resistances gets broken to the upside the next resistance can be located at 1.1274 , according to the Technical Confluences Indicator.

Additional key levels
