Back


6 Aug 2019
EUR/USD technical analysis: Euro records its largest daily advance since January 2019
- EUR/USD reaches its highest level in two weeks as the trade war damages the US Dollar.
- The level to beat for bulls are seen at the 1.1120 and 1.1255 levels.
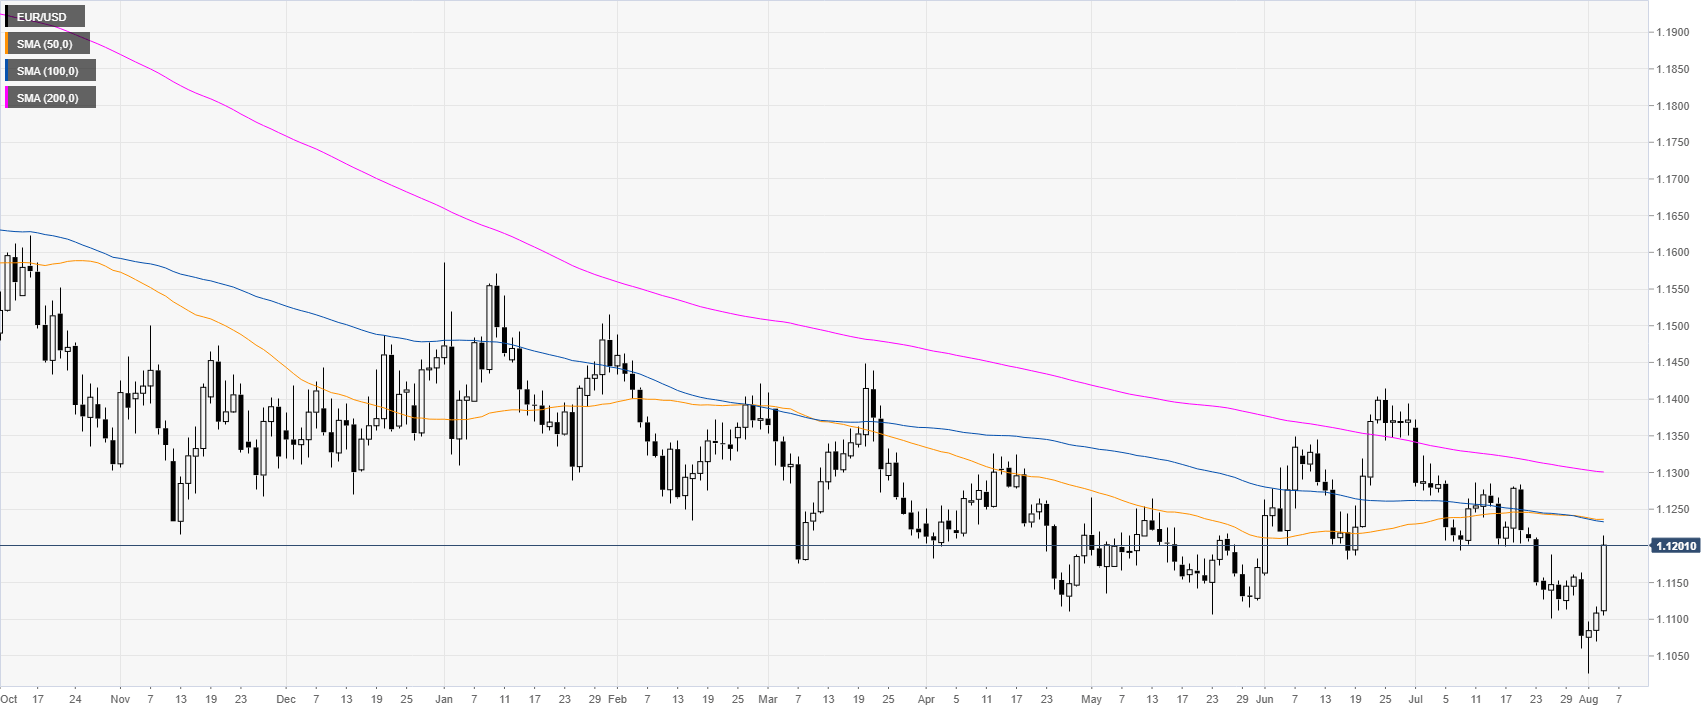
EUR/USD daily chart
EUR/USD is reversing up from the 2019 low as the market is trading in a bear trend below its main daily simple moving averages (DSMAs). The Federal Reserve is now expected to cut rates more aggressively to counteract the damage of the US-China trade war.
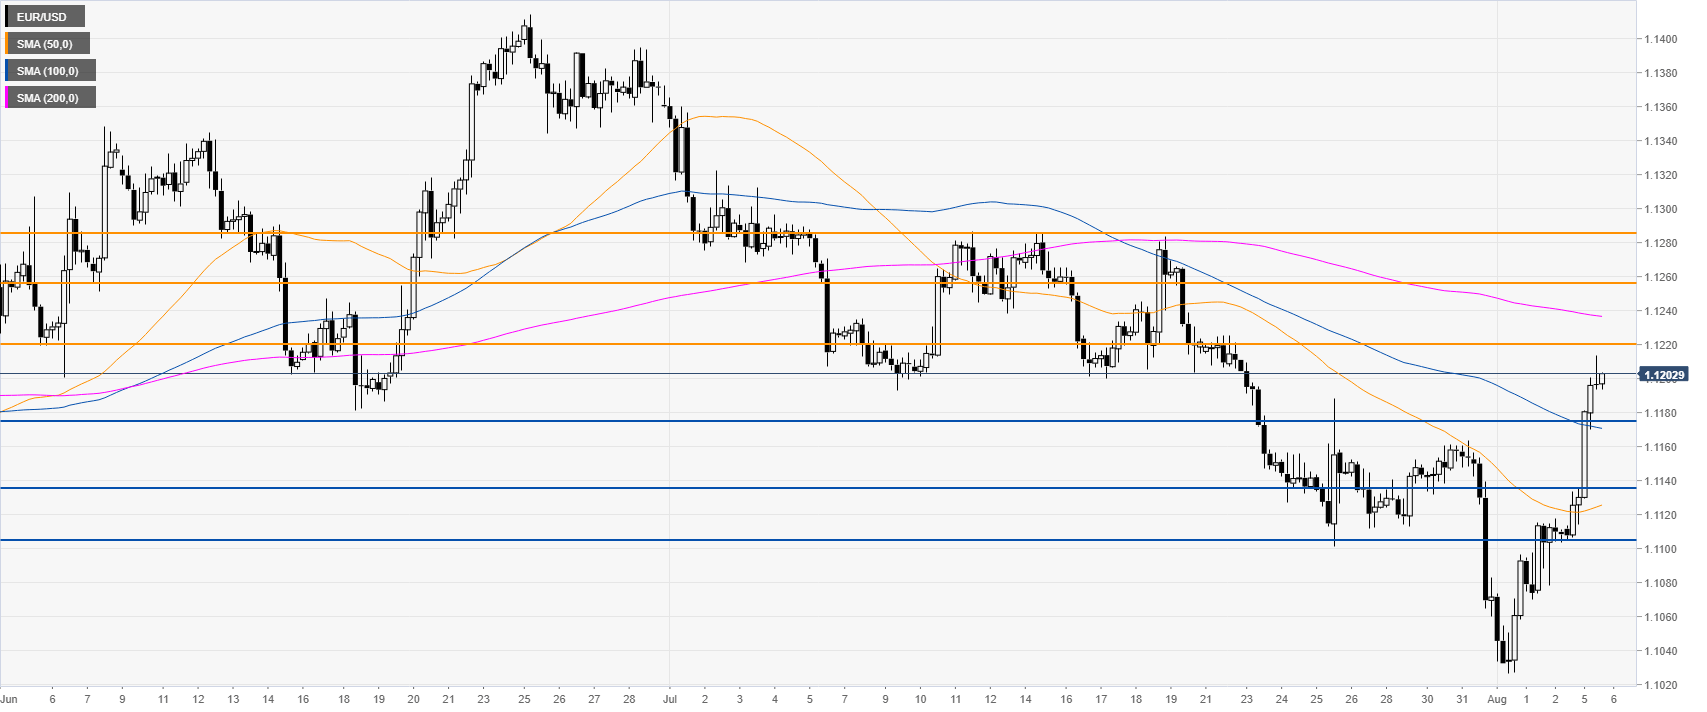
EUR/USD 4-hour chart
EUR/USD broke above the 1.1174 resistance and the 100 SMA. The market is set to keep appreciating towards 1.1120, 1.1255 and 1.1285 resistances, according to the Technical Confluences Indicator.

EUR/USD 30-minute chart
This Monday the market recorded its largest daily advance since January 2019 as the bulls have been relentless. Support can be seen near 1.1174, 1.1135, 1.1121 and 1.1100 levels.

Additional key levels

