Back
30 Oct 2019
US Dollar Index technical analysis: DXY trades at three-day lows after Fed’s rate cut and press conference
- The US Dollar Index (DXY) is under pressure after the Fed’s rate cut and the press conference.
- The market is challenging 97.45 support. Further weakness to 97.20 can be expected below this level.
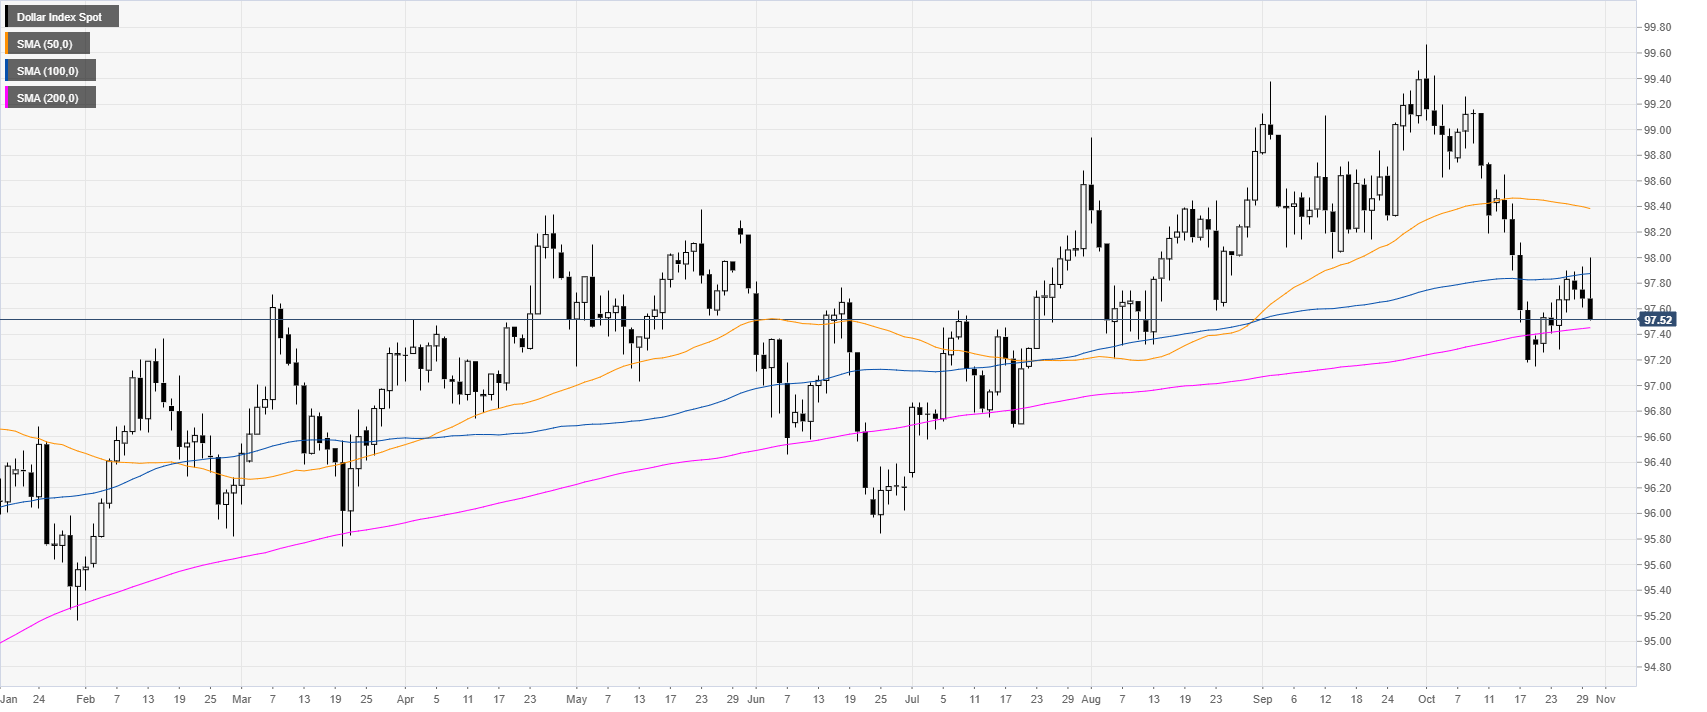
DXY daily chart
The US Dollar Index (DXY) is trading above its 200-day simple moving average (DMA) after a sharp drop in October. The Federal Reserve Bank cut interest rates as expected. After an initial rise, the Buck reversed its gains and is now trading at three-day lows. The decline was triggered during the press conference.
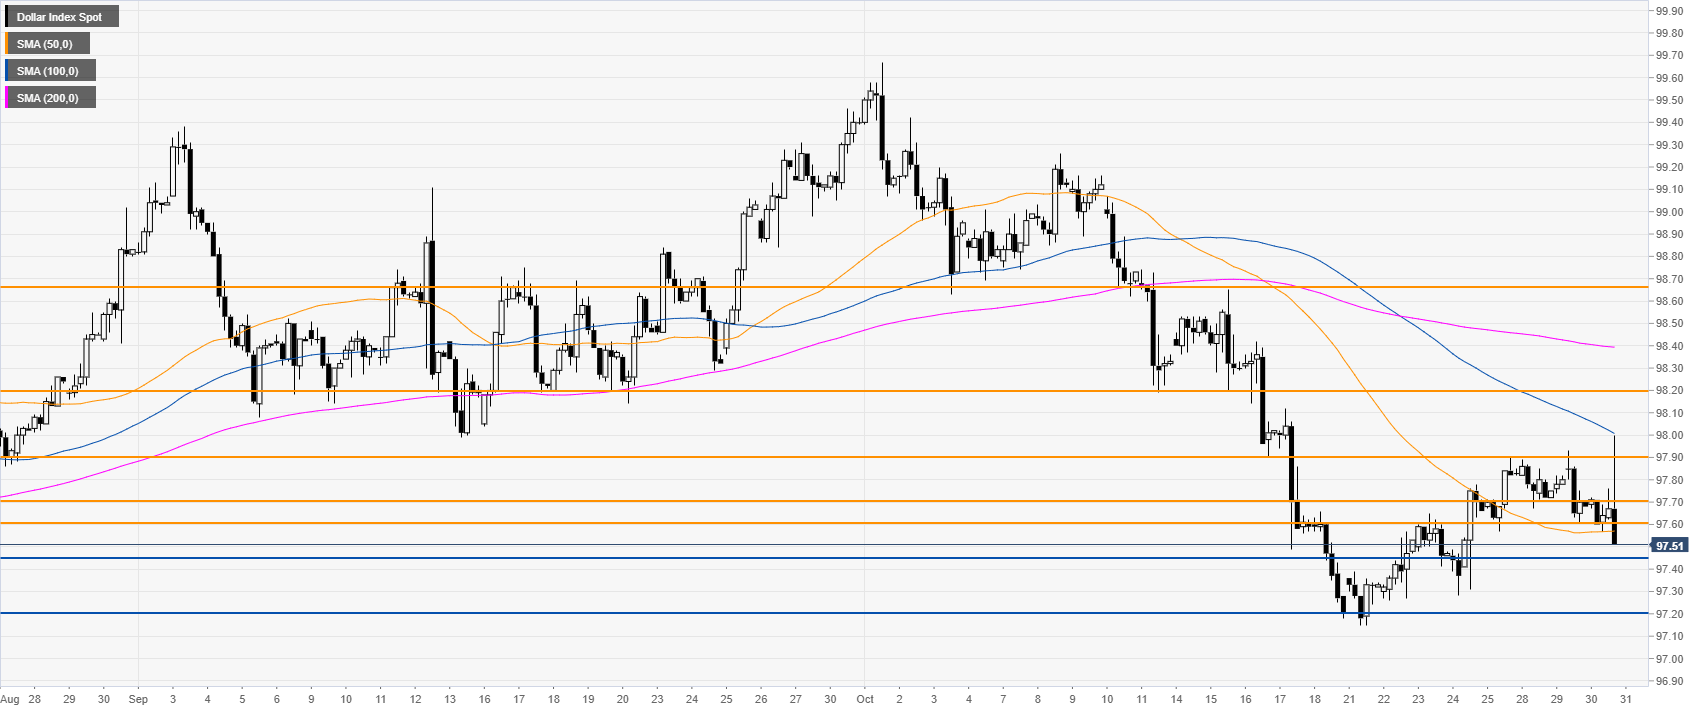
DXY four-hour chart
On the four-hour chart, the Greenback broke below the 97.650 support while trading below its main SMAs. The market can continue to decline towards 97.45 and 97.20 support levels.
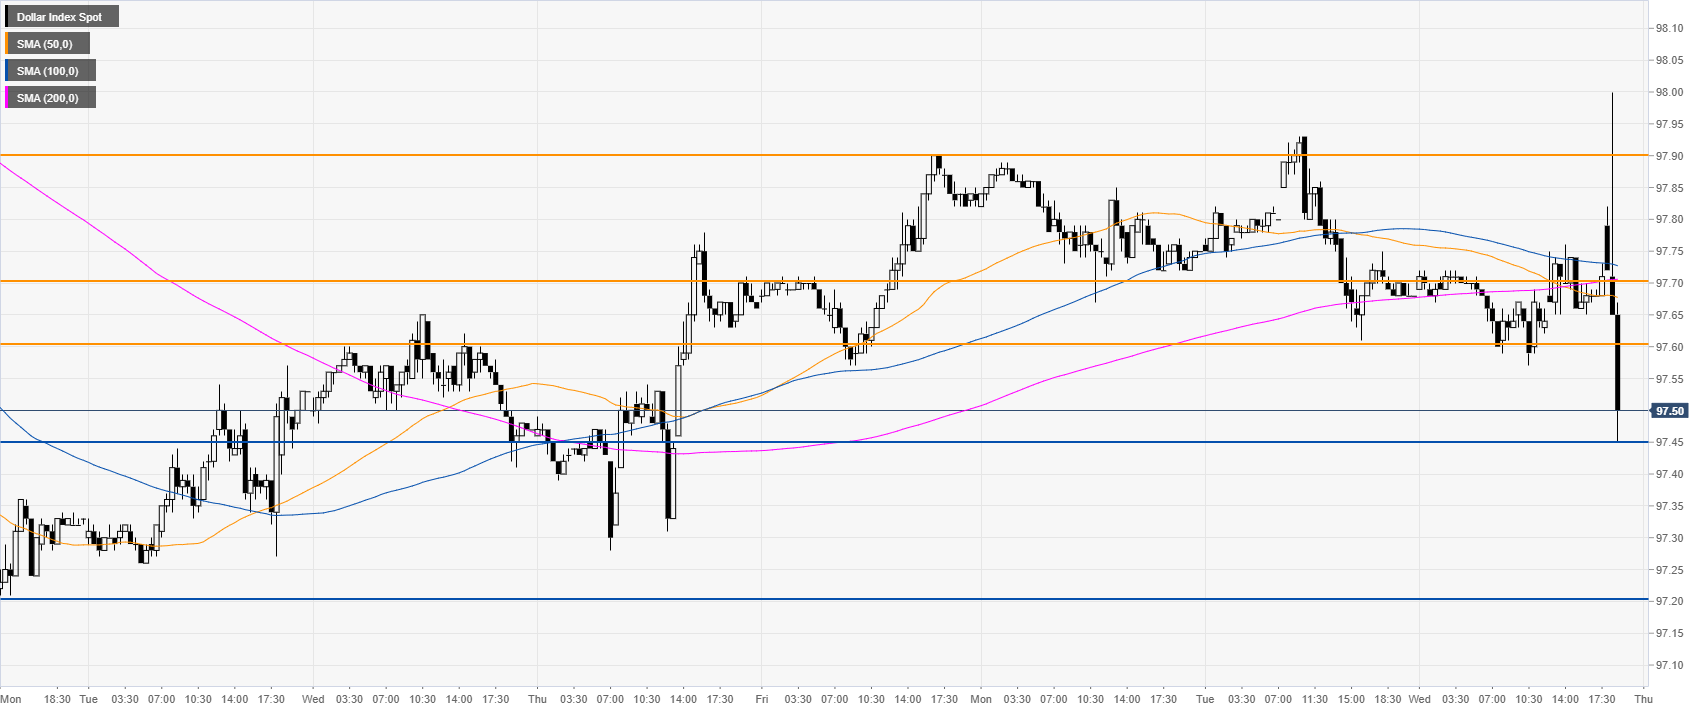
DXY 30-minute chart
DXY is trading below its main SMAs, suggesting a bearish bias in the near term. Resistance is seen at the 97.60/70 zone and 97.90 price level.
Additional key levels