GBP/USD technical analysis: Bounces off 3-week-old rising trendline
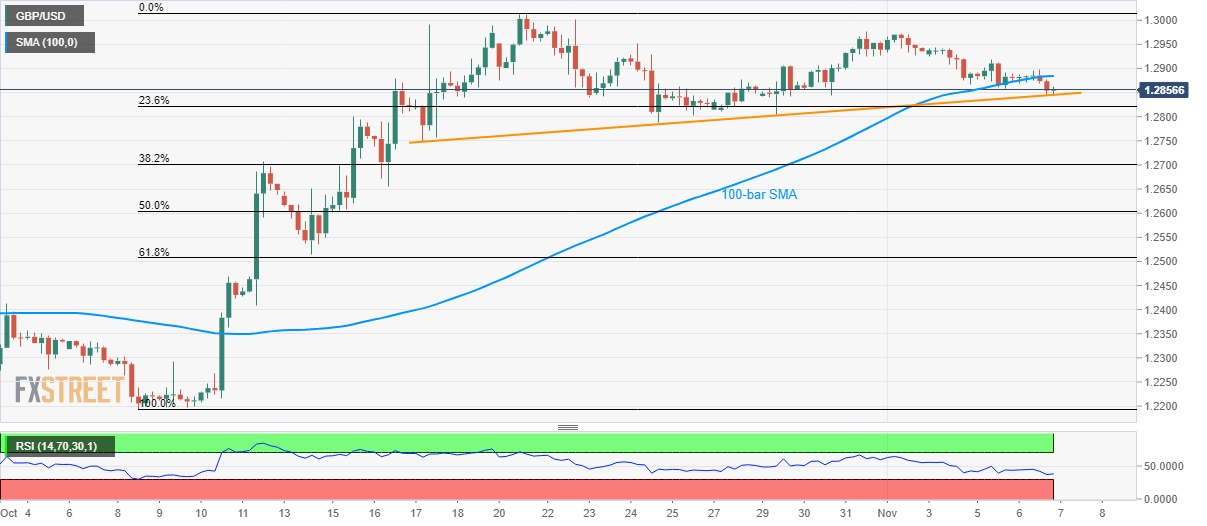
- GBP/USD stays below 100-bar SMA during its gradual decline since the month’s start.
- Weak RSI conditions favor the latest pullback, 1.3000 becomes the key resistance.
Although its first downtick below 100-bar SMA in over a month signals the GBP/USD pair’s weakness, prices recently bounced off short-term support line while taking the bids to 1.2860 during early Asian session on Thursday.
Also Read: Tom Watson announces a shock resignation as MP and Labour Deputy Leader – The Telegraph
Buyers now await a clear break above 100-bar Simple Moving Average (SMA) level of 1.2885 to question the current week high near 1.2940 ahead of aiming monthly top close to 1.2975.
It should, however, be noted that weak conditions of the 14-bar Relative Strength Index (RSI) also favor the pair’s recent pullback. Though, 1.3000 psychological magnet and the October month high around 1.3015 seem to be tough resistance on the upside.
Alternatively, pair’s declines below 1.2845 support line will trigger fresh downpour to 1.2800 while 1.2750 and October 11 high near 1.2710 could keep sellers happy afterward.
GBP/USD 4-hour chart
Trend: pullback expected