USD/IDR Technical Analysis: Bearish Marubozu keep sellers hopeful
- USD/IDR fails to recover the previous day’s losses.
- Multiple rising trend lines on the Bears’ radar.
- Buyers will wait for entry beyond the monthly top.
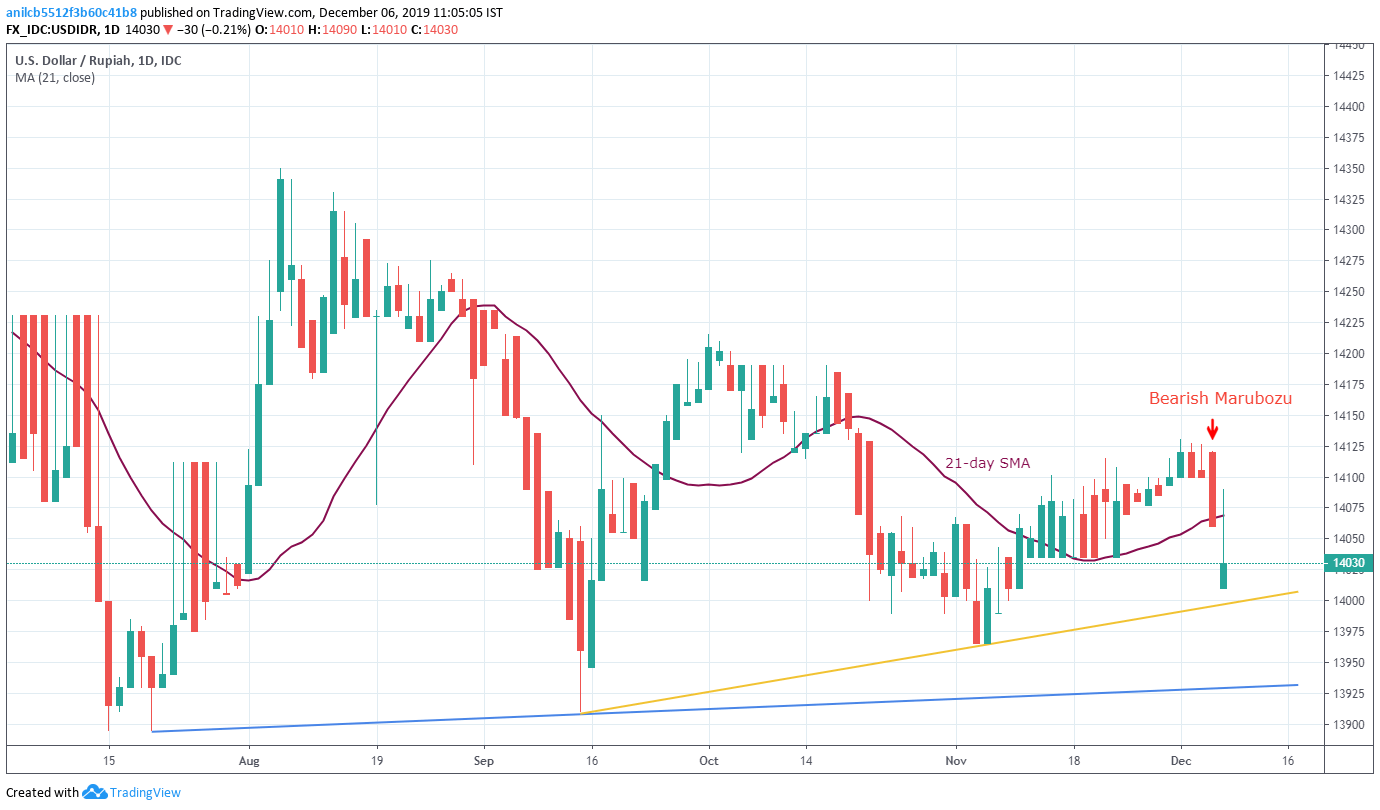
USD/IDR fails to hold onto recovery gains while trading around 14,030 ahead of Friday’s European session. That said, the pair portrayed a bearish candlestick formation as it dropped heavily on Thursday.
In addition to the Bearish Marubozu, pair’s failure to cross 21-day Simple Moving Average (SMA), at 14,070 now, during the early-day bounce, also portrays the underlying weakness in momentum.
As a result, sellers are now gearing up to visit an upward sloping trend line since mid-September around 14,000 whereas a bit less slanted rising support line from July, at 13,925 now, will be in focus afterward.
On the contrary, pair’s run-up beyond 21-day SMA level of 14,070 can push prices towards the monthly high of 14,130.
Though, major bulls are likely to wait for a daily closing beyond 14.130 before targeting October top near 14,215.
USD/IDR daily chart
Trend: Bearish