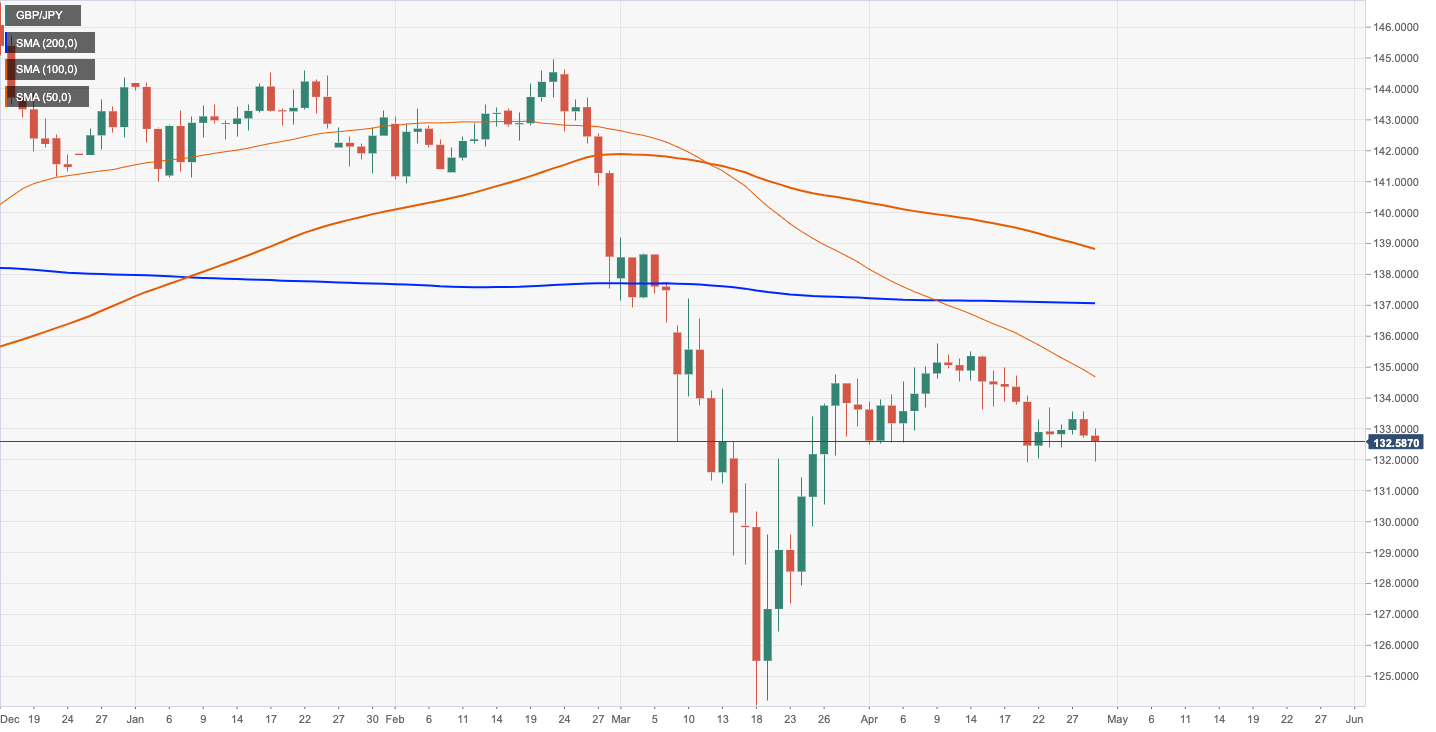
GBP/JPY Price Analysis: hovering dangerously above 131.94 support
- GBP/JPY recovery from 124.00 lows has lost steam and the pair us testing support at 131.94
- A successful break of 131.95 might add bearish pressure and open the doors for 130.00
The pound is heading south ground for the second consecutive day on Wednesday, extending the reversal from Monday and Tuesday highs at 133.50 area, to test key support area at 131.90.
The daily chart shows the pound in a consolidation channel after an upward correction from long-term lows at 124.05 reached on mid-March, yet trading well below the main moving averages.
GBP/JPY daily chart
The 4-hour chart shows the GBP/JPY is looking increasingly heavy, testing the support level at 131.90, which so far remains unbroken. If this line gives way, the bears might gain momentum and send the pair towards 130.00 (April 25 low) and then Probably April 23 low at 127.50 before the mentioned low at 124.05.
On the upside, the sterling is struggling to extend its recovery above the 200 SMA, now at 132.70. Above here, the pair should also break above 133.00 area, where the 50 SMA lies, to ease bearish pressure and aim for 134.55/70 area (April 23,27 and 28 highs).
GBP/JPY 4-hour chart
-637237729636201860.png)