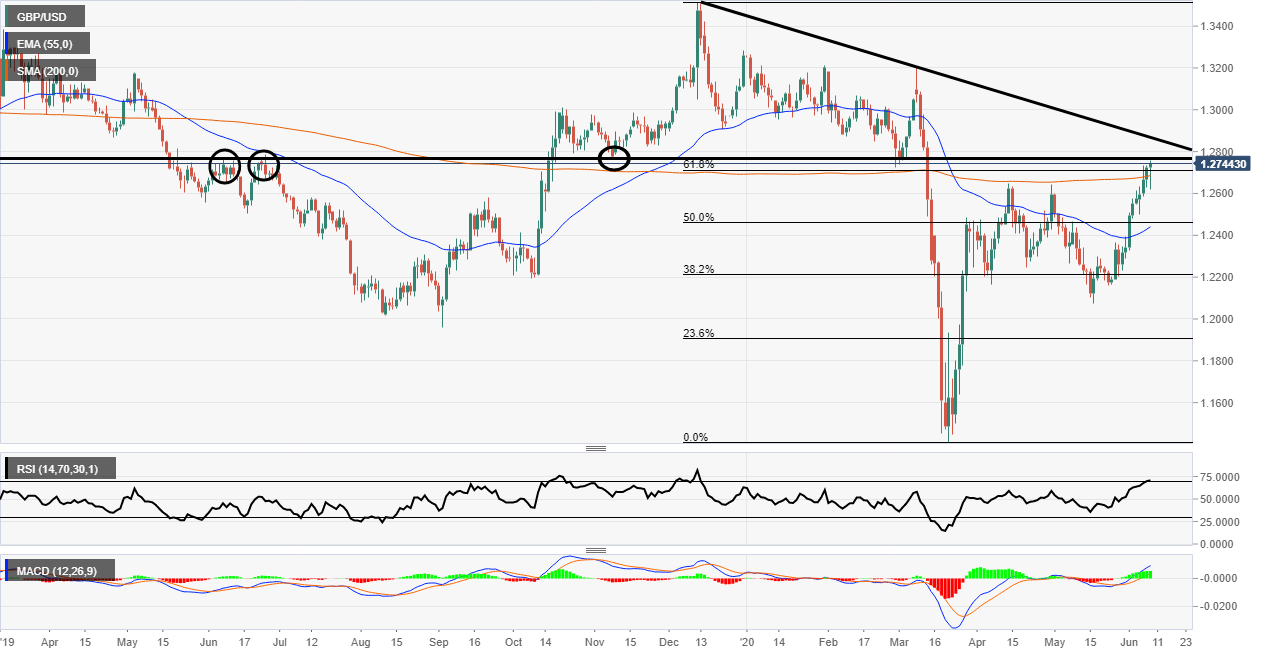
GBP/USD daily chart shows we are at a key technical resistance zone of 1.2750
- More USD selling pushes cable to trade 0.14% higher after being in the red for most of the session.
- The price is now firmly above the 200 Simple Moving Average.
GBP/USD daily chart
GBP/USD looked at one point like it would topple over but the USD sellers came back in full force and the pair moved higher. This means the price is now firmly above the 200 period Simple Moving Average (SMA).
This now brings the price right up to the resistance line where the price has reacted a few times on the chart already (circles). Alongside this, the market is also at the 61.8% Fibonacci retracement zone.
Conversely, the Relative Strength Index is looking very overbought. This indicates there could be some kind of pullback as the market is overextended to the upside. The MACD is looking very bullish as the signal lines are above the mid-point and the histogram is green.
Lastly, there is a black trendline above the current price level and if the market keeps moving higher the level could provide some resistance. It must be noted that the trend is still up but the Fed meeting is an important event and traders are waiting for more clarity from the central bank.

Additional levels
