EUR/GBP Price Analysis: Justifies weekly Doji with biggest gains in four months, 0.9175 on bulls’ radar
- EUR/GBP trades in a choppy range below 0.9100 even after Wednesday’s pullback from six-week top.
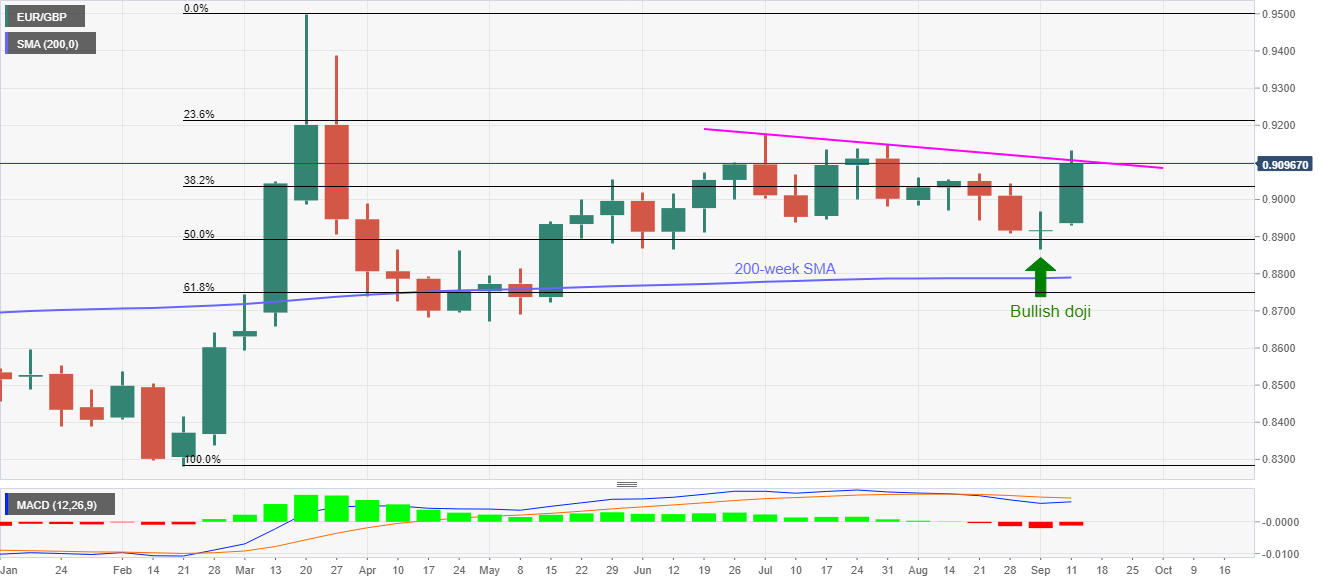
- Weekly candlestick suggested bullish reversal, July high in focus.
- 200-week SMA, 50% Fibonacci retracement will be the key support.
Despite trading in a seven-pip range below 0.9103, currently around 0.9096, EUR/GBP prints 0.20% intraday gains while heading into Thursday’s European open.
The Euro cross takes bullish clues from the previous week’s Doji candlestick above 200-week SMA. Though, a downward sloping trend line from July restricts the pair’s immediate upside around 0.9100.
If buyers chose to ignore bearish MACD, July month’s top of 0.9175 can lure them before aiming to refresh the yearly peak surrounding 0.9500.
Meanwhile, the pair’s pullback can avail 0.9000 and 0.8970 as nearby rest-points prior to highlighting the 50% Fibonacci retracement of February-March run-up around 0.8895.
Even if the pair drops below 0.8895, 200-week SMA, at 0.8790, can offer a chance to its bounce, which if overruled will direct the bears towards a 61.8% Fibonacci retracement level of 0.8748 and May month’s low near 0.8671.
EUR/GBP Weekly chart
Trend: Further upside expected