GBP/USD Price Analysis: Clings to 1.2940/35 support confluence
- GBP/USD sellers catch a breather around three-day low.
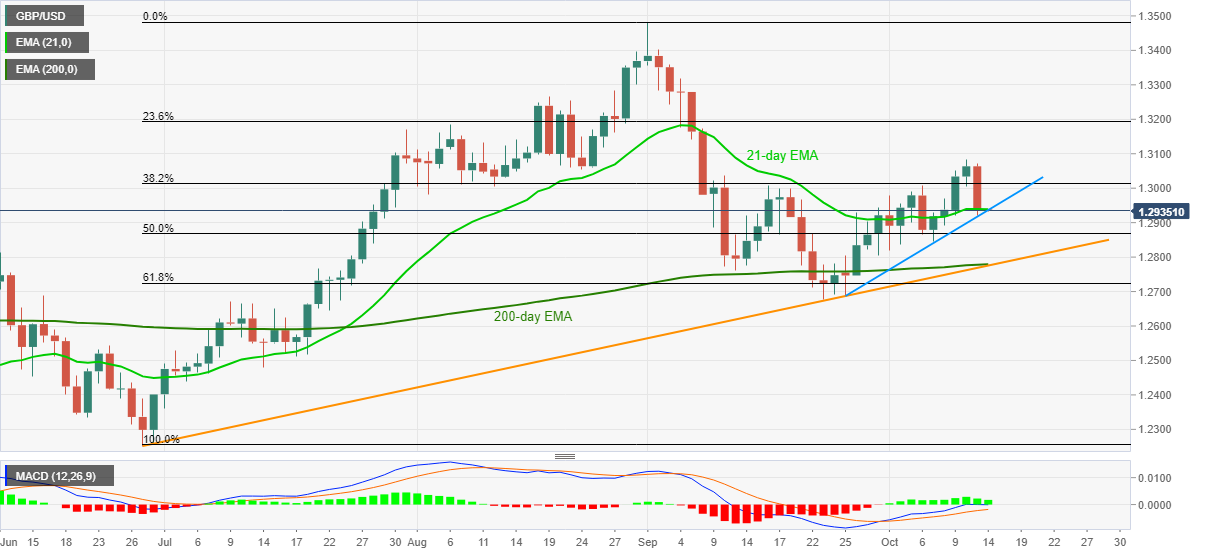
- A confluence of 21-day EMA, an ascending trend line from September 25 restricts immediate downside.
- 38.2% Fibonacci retracement, late-August tops offer immediate resistance.
GBP/USD treads water around 1.2930/40/35 during Wednesday’s Asian session. The pair dropped the heaviest on Tuesday but couldn’t crack a join of the short-term EMA and nearby support line amid bullish MACD.
The same teases the buyers to attach 38.2% Fibonacci retracement of June-September upside, at 1.3013, while also keeping eyes on the August 24 low near 1.3050/55 during the further recovery.
In a case where the bulls manage to cross 1.3055, the monthly high of 1.3082 offers an extra filter to the north.
Meanwhile, a downside break of 1.2935 can test a 50% Fibonacci retracement level of 1.2868 whereas a join of 200-day EMA and an upward sloping trend line from June 29, near 1.2780/75, can challenge GBP/USD bears afterward.
It should also be noted that the 61.8% Fibonacci retracement and the September month’s low, respectively around 1.2720 and 1.2675, can lure the sellers after 1.2775.
GBP/USD daily chart
Trend: Pullback expected