GBP/USD Price Analysis: Bulls and bears jostle around 1.3900
- GBP/USD struggles to keep late Monday’s recovery moves from 1.3852.
- Bearish momentum, failures to cross short-term resistance line favor sellers.
- 50-day SMA, 4.5-month-old support line challenge further downside.
GBP/USD hangs around 1.3900 amid the initial Asian session trading on Tuesday. The cable dropped for the second consecutive day on Monday after reversing from a 12-day-long falling trend line during Friday. However, the downside faltered around mid-1.3800s before struggling for direction off-late.
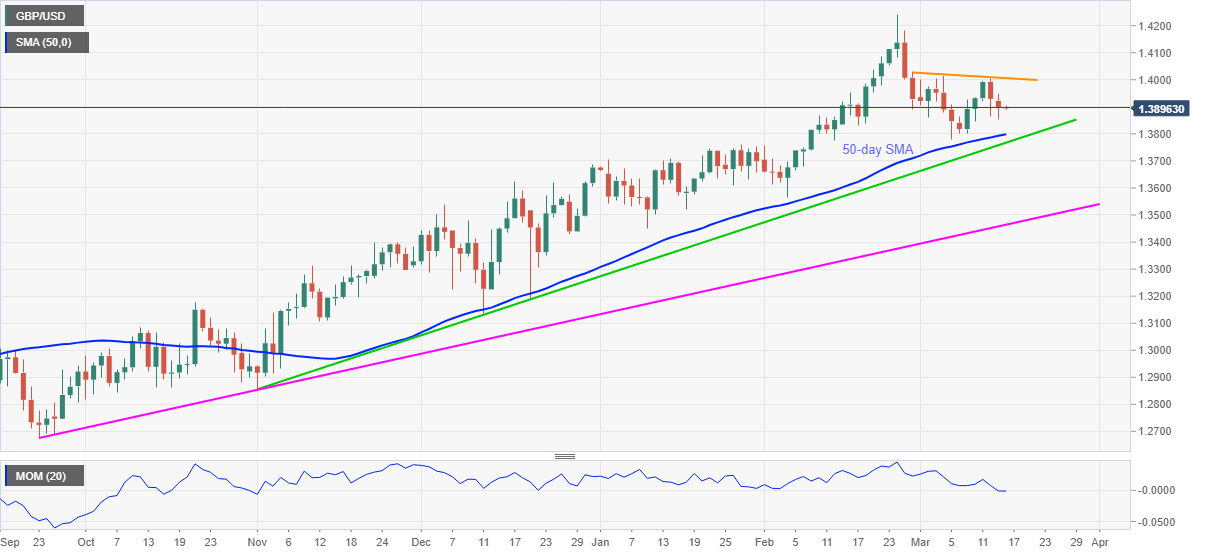
Considering the GBP/USD pair’s sustained weakness below the stated resistance line, at 1.4006 now, coupled with the downward sloping Momentum line, sellers are on their way to a 50-day SMA level of 1.3798.
Though, any further weakness past-1.3798 will have to break an ascending support line from early November 2020, currently around 1.3765, to convince the GBP/USD bears.
Meanwhile, recovery moves need to break the immediate resistance line near 1.4010 before directing GBP/USD buyers towards the monthly top of 1.4017 and February 26 peak close to 1.4030.
In a case where the quote manages to cross 1.4030 on a daily closing basis, its run-up to refresh the multi-month top, marked the previous month, around 1.4245, can’t be ruled out.
GBP/USD daily chart
Trend: Further weakness expected