EUR/USD Price Analysis: Seesaws inside short-term triangle above 200-SMA
- EUR/USD stays sidelined around the upper line of eight-day-old symmetrical triangle.
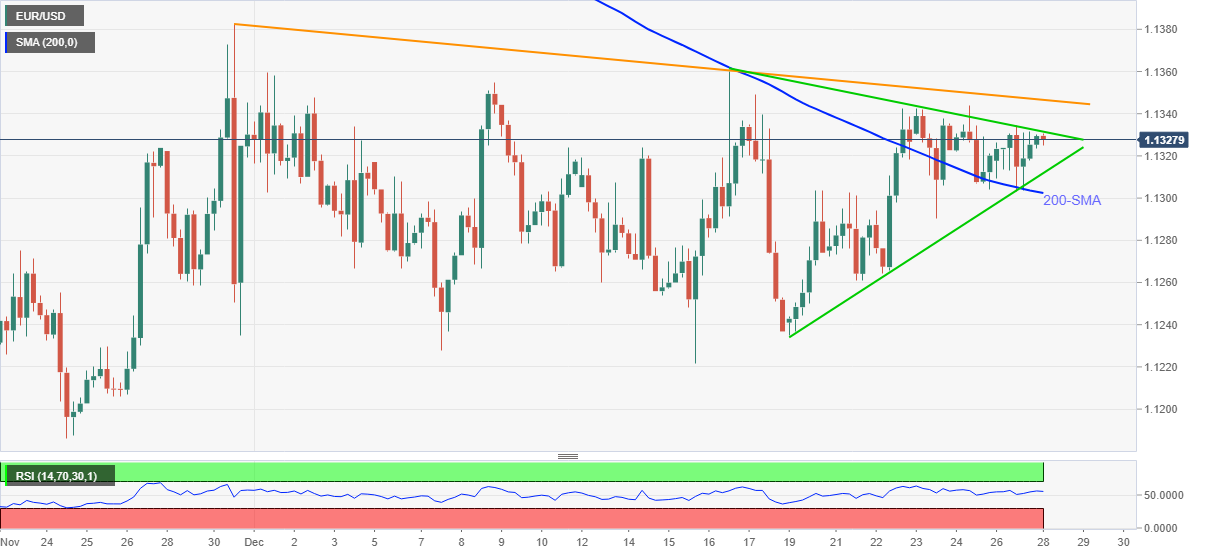
- Firmer RSI, sustained trading beyond 200-SMA favor bullish bias.
- Monthly resistance line adds to the upside filters.
EUR/USD grinds higher past 1.1300, around 1.1330 during Tuesday’s Asian session.
In doing so, the major currency pair seesaws inside a symmetrical triangle formation established on December 16. However, the quote’s successful trading above 200-SMA and firmer RSI, not overbought, keep the buyers hopeful.
It should also be noted that an upside clearance of the stated triangle’s resistance line, near 1.1340 at the latest, will need validation from a descending trend line from November 30, surrounding 1.1350, to offer a smooth ride to the EUR/USD bulls.
During the same, the monthly peak of 1.1360 and late November’s top surrounding 1.1385 will act as buffers.
Alternatively, EUR/USD bears won’t be lured on a downside break of the triangle’s support, close to 1.1330, as the 200-SMA level of 1.1300 offers a tough nut to crack for seller’s entry.
Following that, 1.1260 and the monthly low around 1.1220 will be in focus.
EUR/USD: Four-hour chart
Trend: Further upside expected