WTI Price Analysis: Recovery jostles with monthly support-turned-resistance near $84.00
- WTI extends Monday’s corrective pullback from weekly low.
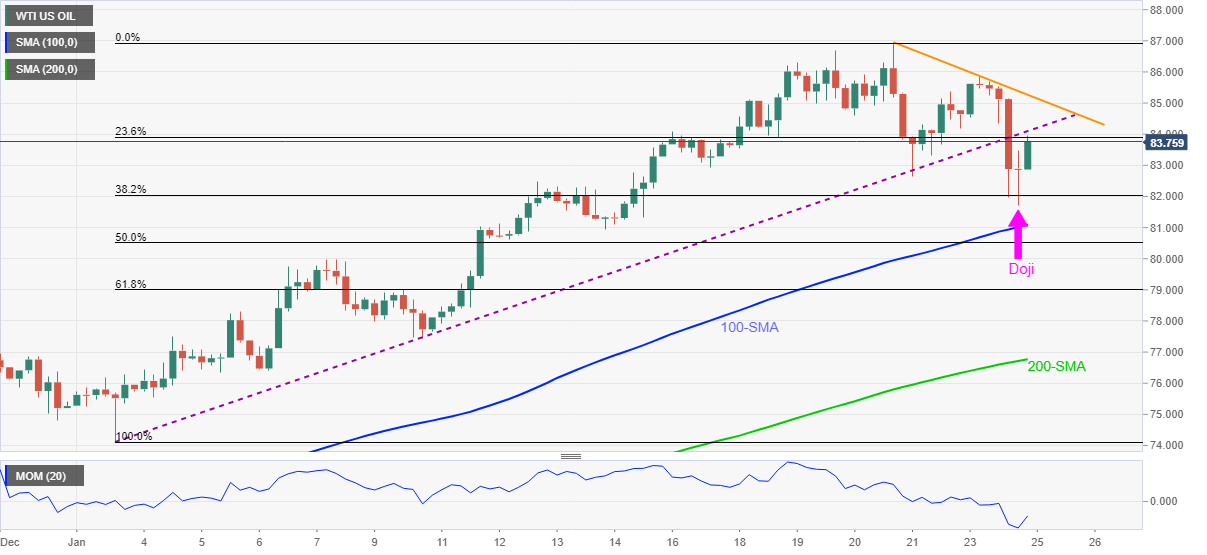
- Bullish Doji above the key SMAs, Momentum line’s rebound favors further recovery.
- Three-day-old resistance line adds to the upside filters.
WTI picks up bids towards $84.00, extending the late Monday’s recovery during the initial Asian session on Tuesday.
The oil benchmark’s latest recovery takes clues from a bullish Doji candlestick and Momentum line.
However, the monthly support line, now resistance around $84.00, precedes a descending trend line from the last Thursday, near $85.30, to test the recovery moves.
Following that, the recent high surrounding $86.95 may offer an intermediate halt during the run-up to the $90.00 psychological magnet.
Alternatively, pullback moves may initially aim for the 100-SMA level of $81.10 before eyeing the $80.00 round figure.
Though, WTI sellers may have a tough time keeping reins past $80.00 as the 200-SMA level of $76.75 will challenge further weakness of the commodity.
WTI: Four-hour chart
Trend: Further upside expected