USD/CAD Price Analysis: Bears have eyes on 61.8% golden ratio
- USD/CAD bears are taking control with eyes on the Fibonacci retracement levels.
- The W-formation's neckline is located near a 61.8% Fibo.
USD/CAD bears stayed in charge despite yesterday's prospects of an upside continuation from hourly support. Instead, the bears have cracked this important area and the price is now offering a discount on a restest of what would be expected now act as resistance.
USD/CAD daily charts
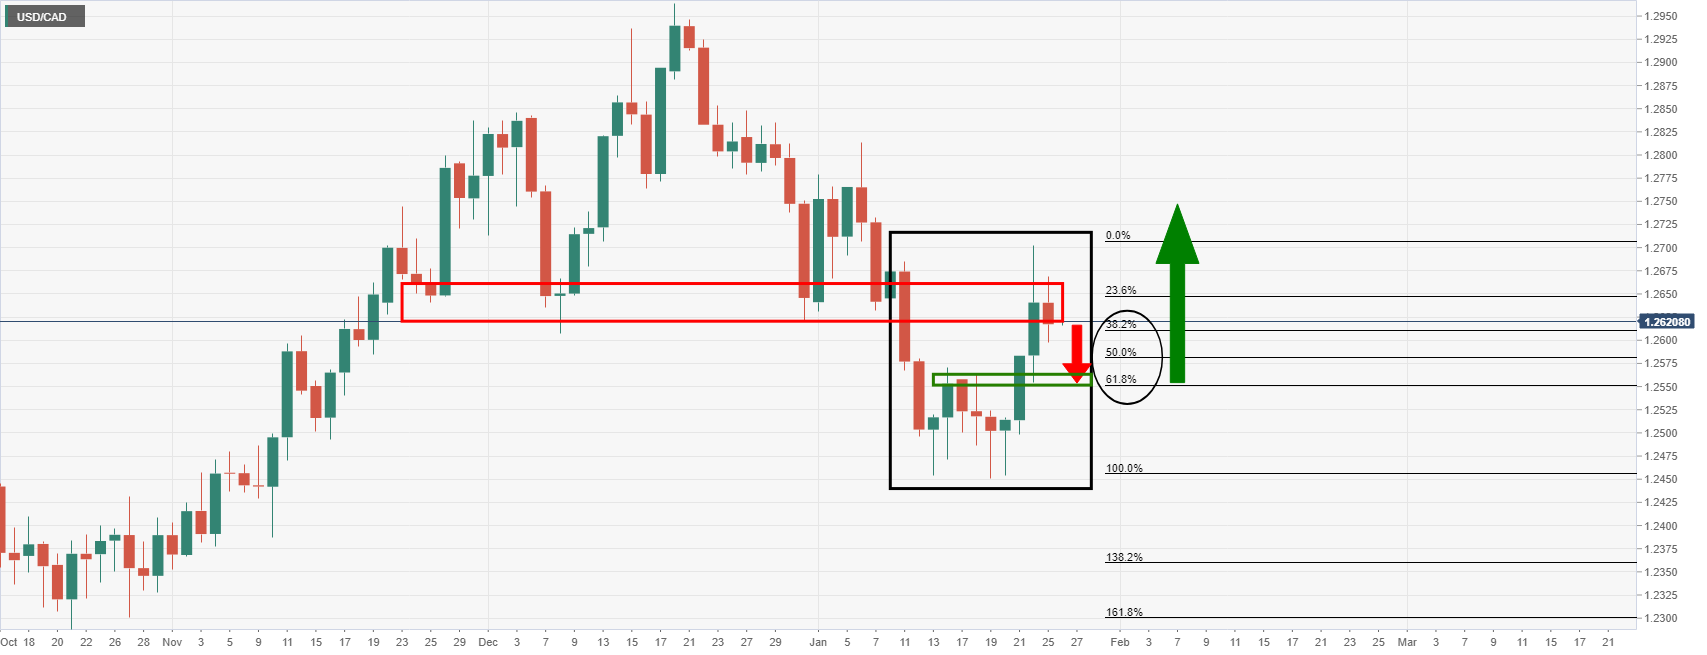
The double bottom lows have resulted in the bullish impulse of late which ran into old support that acted as resistance. Now, the price is en route to significant Fibonacci retracement levels where a deep correction to the W-formation's neckline near 1.2550 would be expected to hold initial tests. In doing so, the price could build up a pile of demand and result in an upside continuation.
On the other hand ...
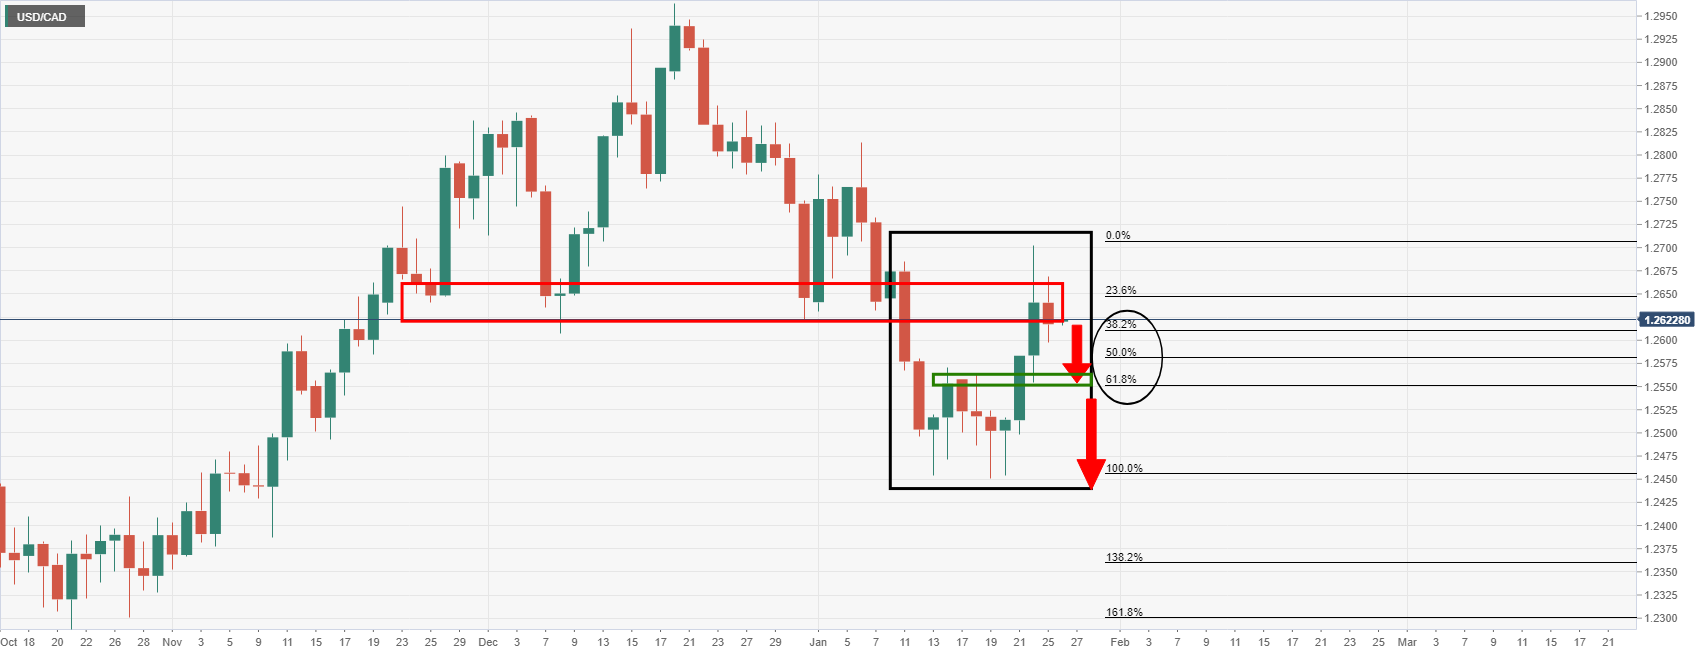
The double bottom lows, however, will be exposed again should the W-formation's neckline give out. The lower time frames have formed a bearish structure as follows:
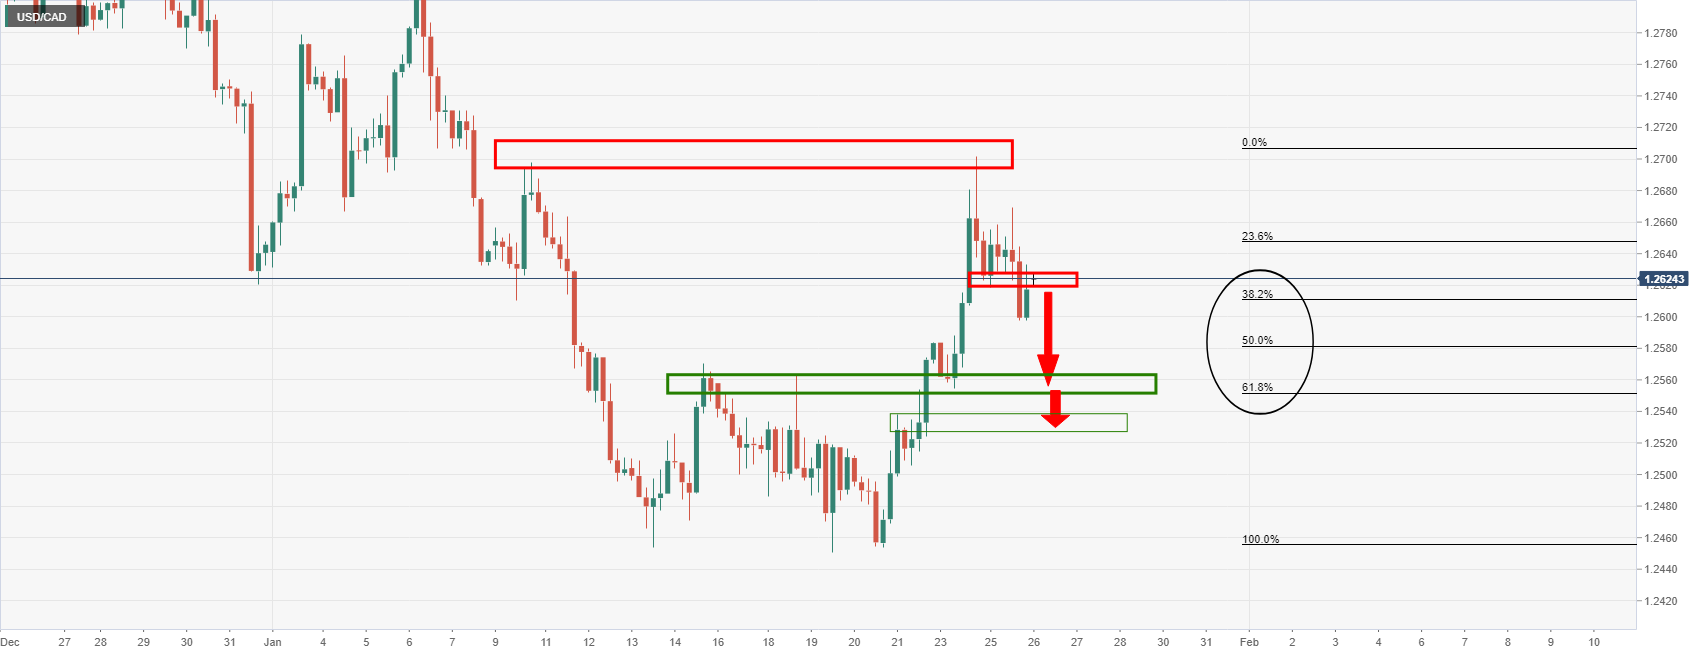
The 4-hour chart's liquidity grab has resulted in the bears taking control. The M-information's neckline has been tested and is acting as resistance. This could be regarded as a discount to the bears engaging here with a focus on the daily Fibos and the W-formation's neckline.