GBP/JPY Price Analysis: Double-top about to reach its target
- The British pound weakens vs. the Japanese yen and drops 0.69%.
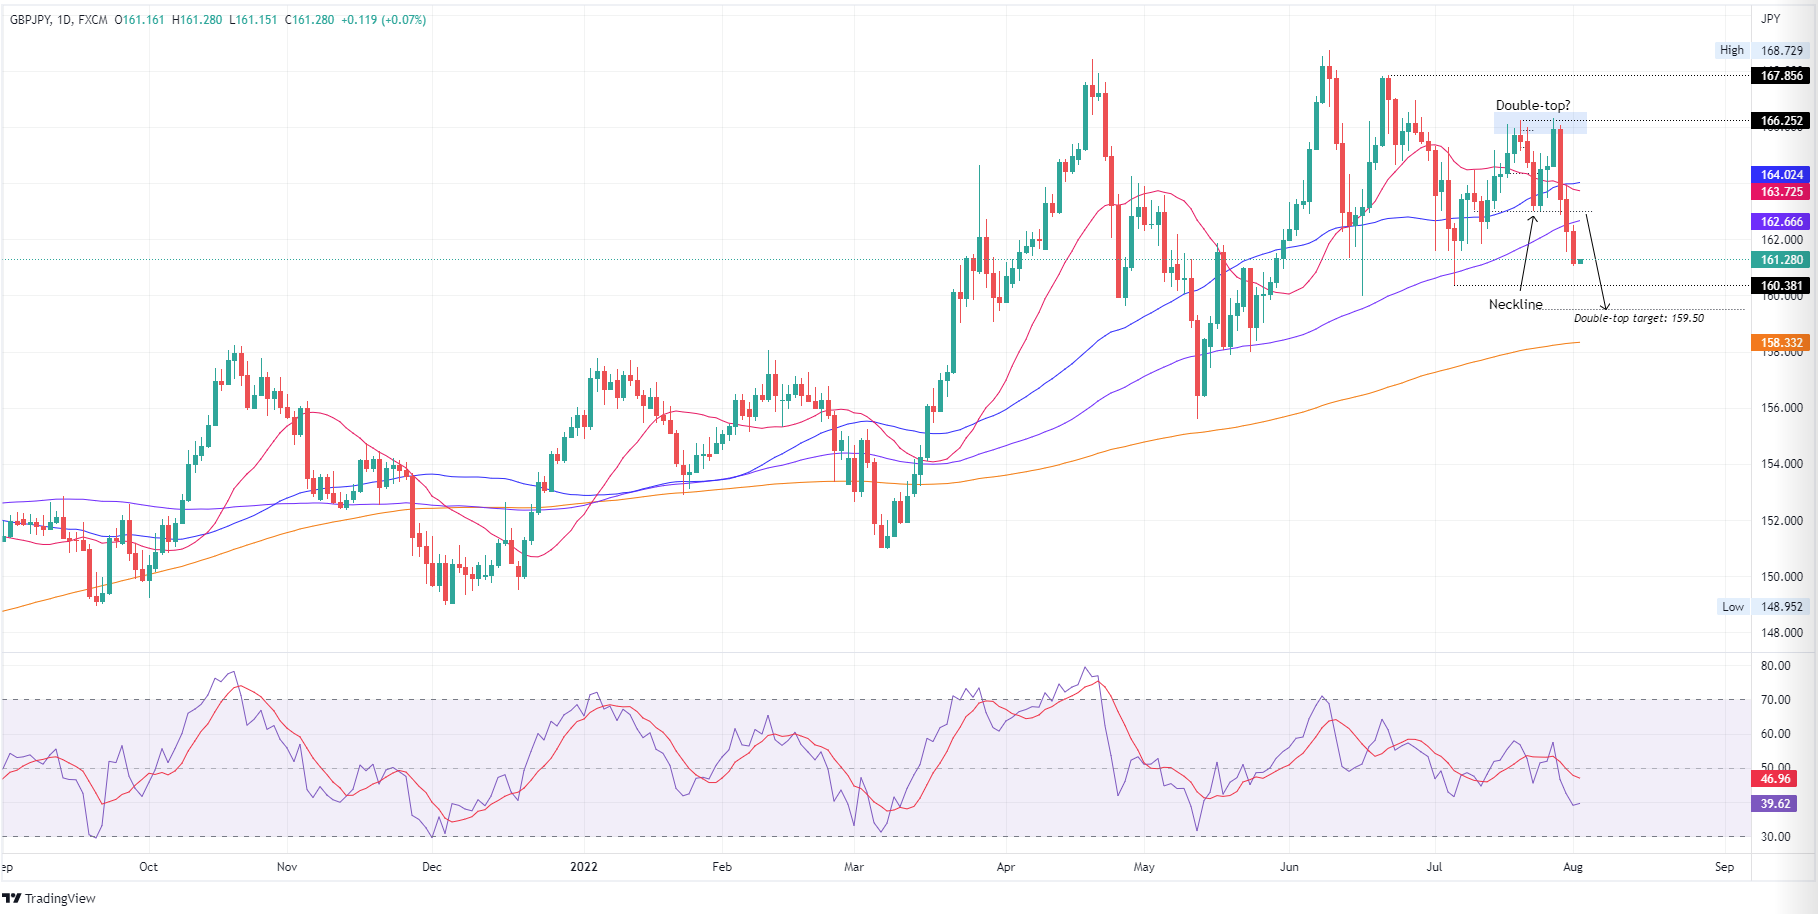
- The GBP/JPY daily chart illustrates the double-tops stays in play, and the exchange rate is about to reach its target.
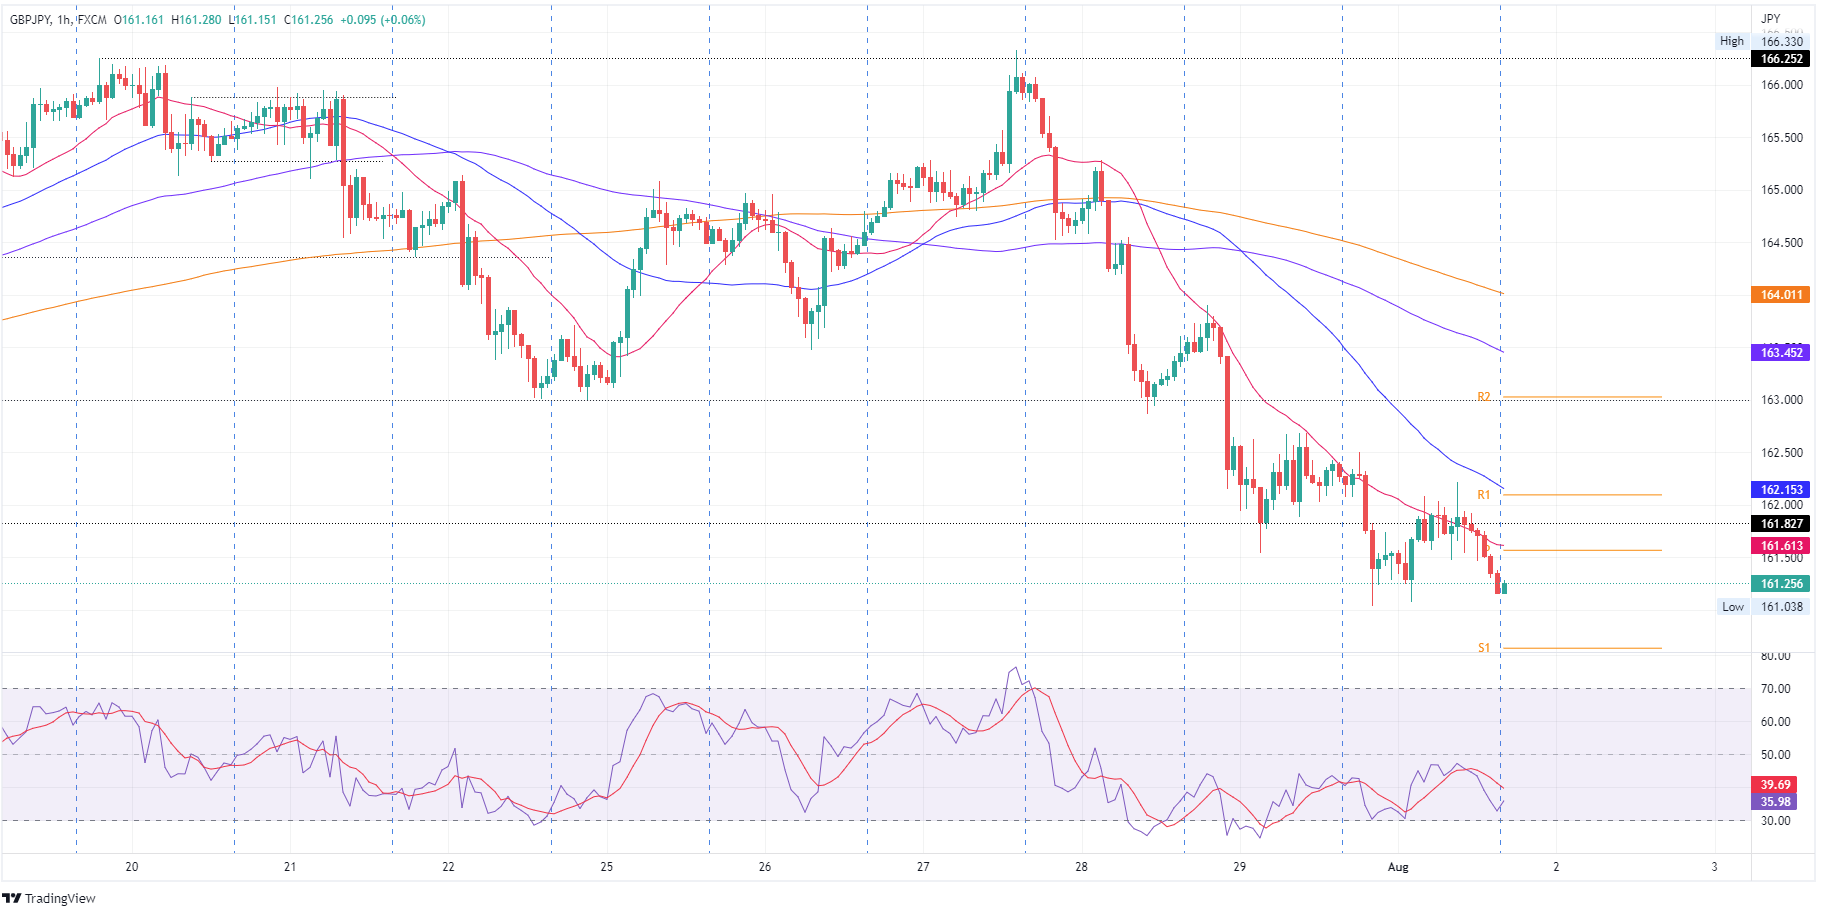
- In the near term, the GBP/JPY might correct to 161.61 before nose-diving towards the double-top target at 159.50.
The GBP/JPY sinks for the third straight day, and the cross-currency pair accelerates towards the double-top price target at 159.50. At 161.25, the GBP/JPY reflects a dampened market mood, spurred by Fed policymakers led by Minnesota’s Fed President Kashkari, who pushed back against a Fed “dovish” tilt and opened the door for further tightening. That, alongside geopolitical tensions between the US and China, arising as the US House Speaker Nancy Pelosi could visit Taiwan.
GBP/JPY Price Analysis: Technical outlook
The GBP/JPY daily chart depicts the pair as neutral-to-downward biased. Break below 163.00, the double-top “neckline” exacerbated the fall, and on its way down, the GBP/JPY cleared the 20, 50, and 100-day EMAs. Traders should notice that the Relative Strength Index (RSI) is in negative territory and with enough room to spare before reaching oversold conditions. Therefore, a move towards the double-top target at 159.50 is on the cards, but firstly, GBP/JPY sellers need to clear the July 6 swing low at 160.38.

GBP/JPY 1-hour chart
In the near term, the GBP/JPY hourly chart illustrates the pair as neutral-to-downward biased, but risks are skewed to the upside. Be aware that the Relative Strength Index (RSI) at 36.72 aims to cross over the 7-hour RSI’s SMA, which could lift the pair, at least towards the confluence of the daily pivot and the 20-hour EMA at 161.61. Nevertheless, failure to do so, the GBP/JPY could dip below the 161.00 mark, towards the 160.00 figure, ahead of the double-top target at 159.50.

GBP/JPY Key Technical Levels
